Time Travel Debugger
Wallaby’s Time Travel Debugger is an advanced tool that allows you to visualize, investigate, and understand the execution of your code. The debugger allows you to move forwards and backwards through your code to identify the conditions that led to a specific bug. It also accelerates your edit, compile and debug loop by allowing you to jump to a specific line of code, view runtime values, edit-and-continue, and step into, over and out of your code.
Starting the Debugger
Once Wallaby has started, the time-travel debugger can be started in a number of ways:
- at the beginning of any test using the
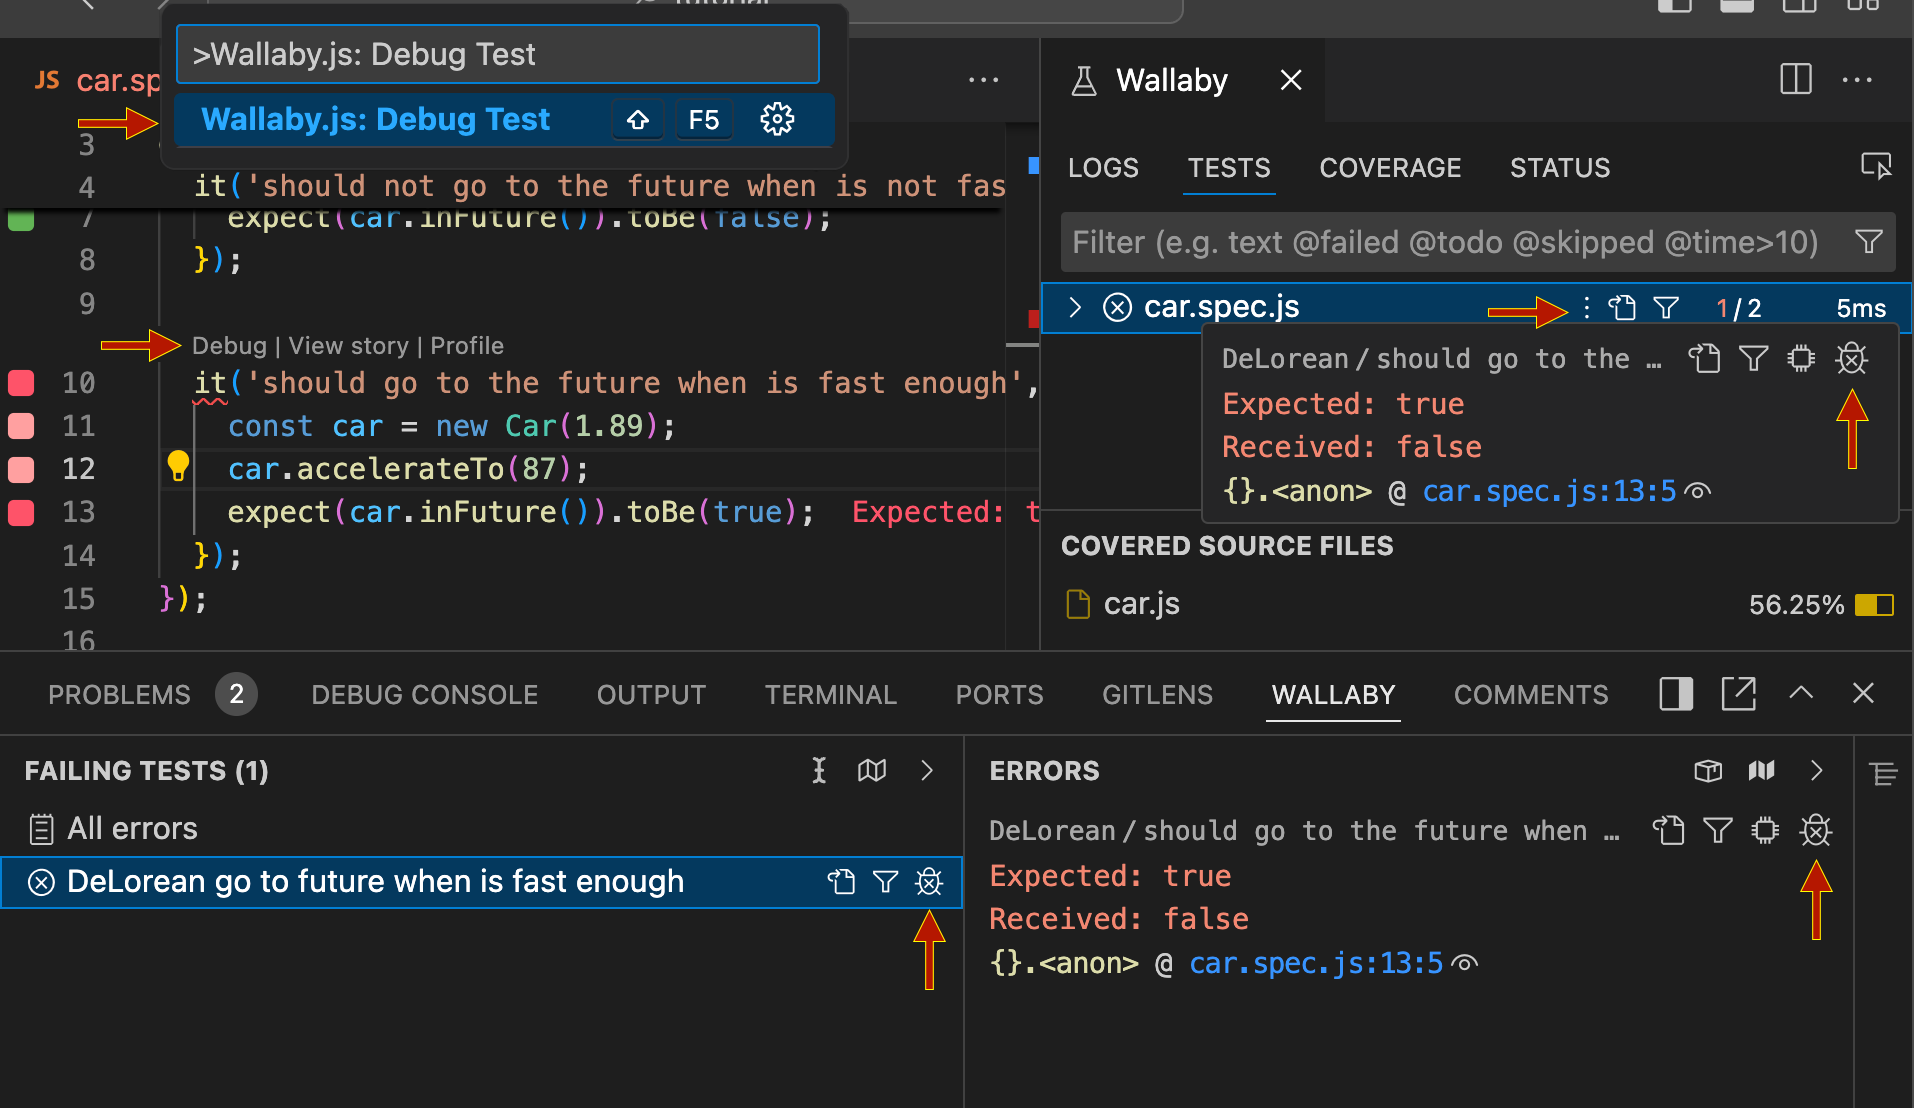
Debugcode lens action above the test - at any covered line (whether in a test file or in code called by a test) by running the
Wallaby.js: Debug Test (Shift + F5)command (when a line is covered by multiple tests, you will be prompted to select which test to debug) - at the beginning of a failing test by clicking the debugger icon next to an entry in the the Overview panel’s
Failing TestsorErrorsviews - at the beginning of any test by clicking the debugger icon while hovering over the
⋮icon next to the test in theTesttab of the Side View
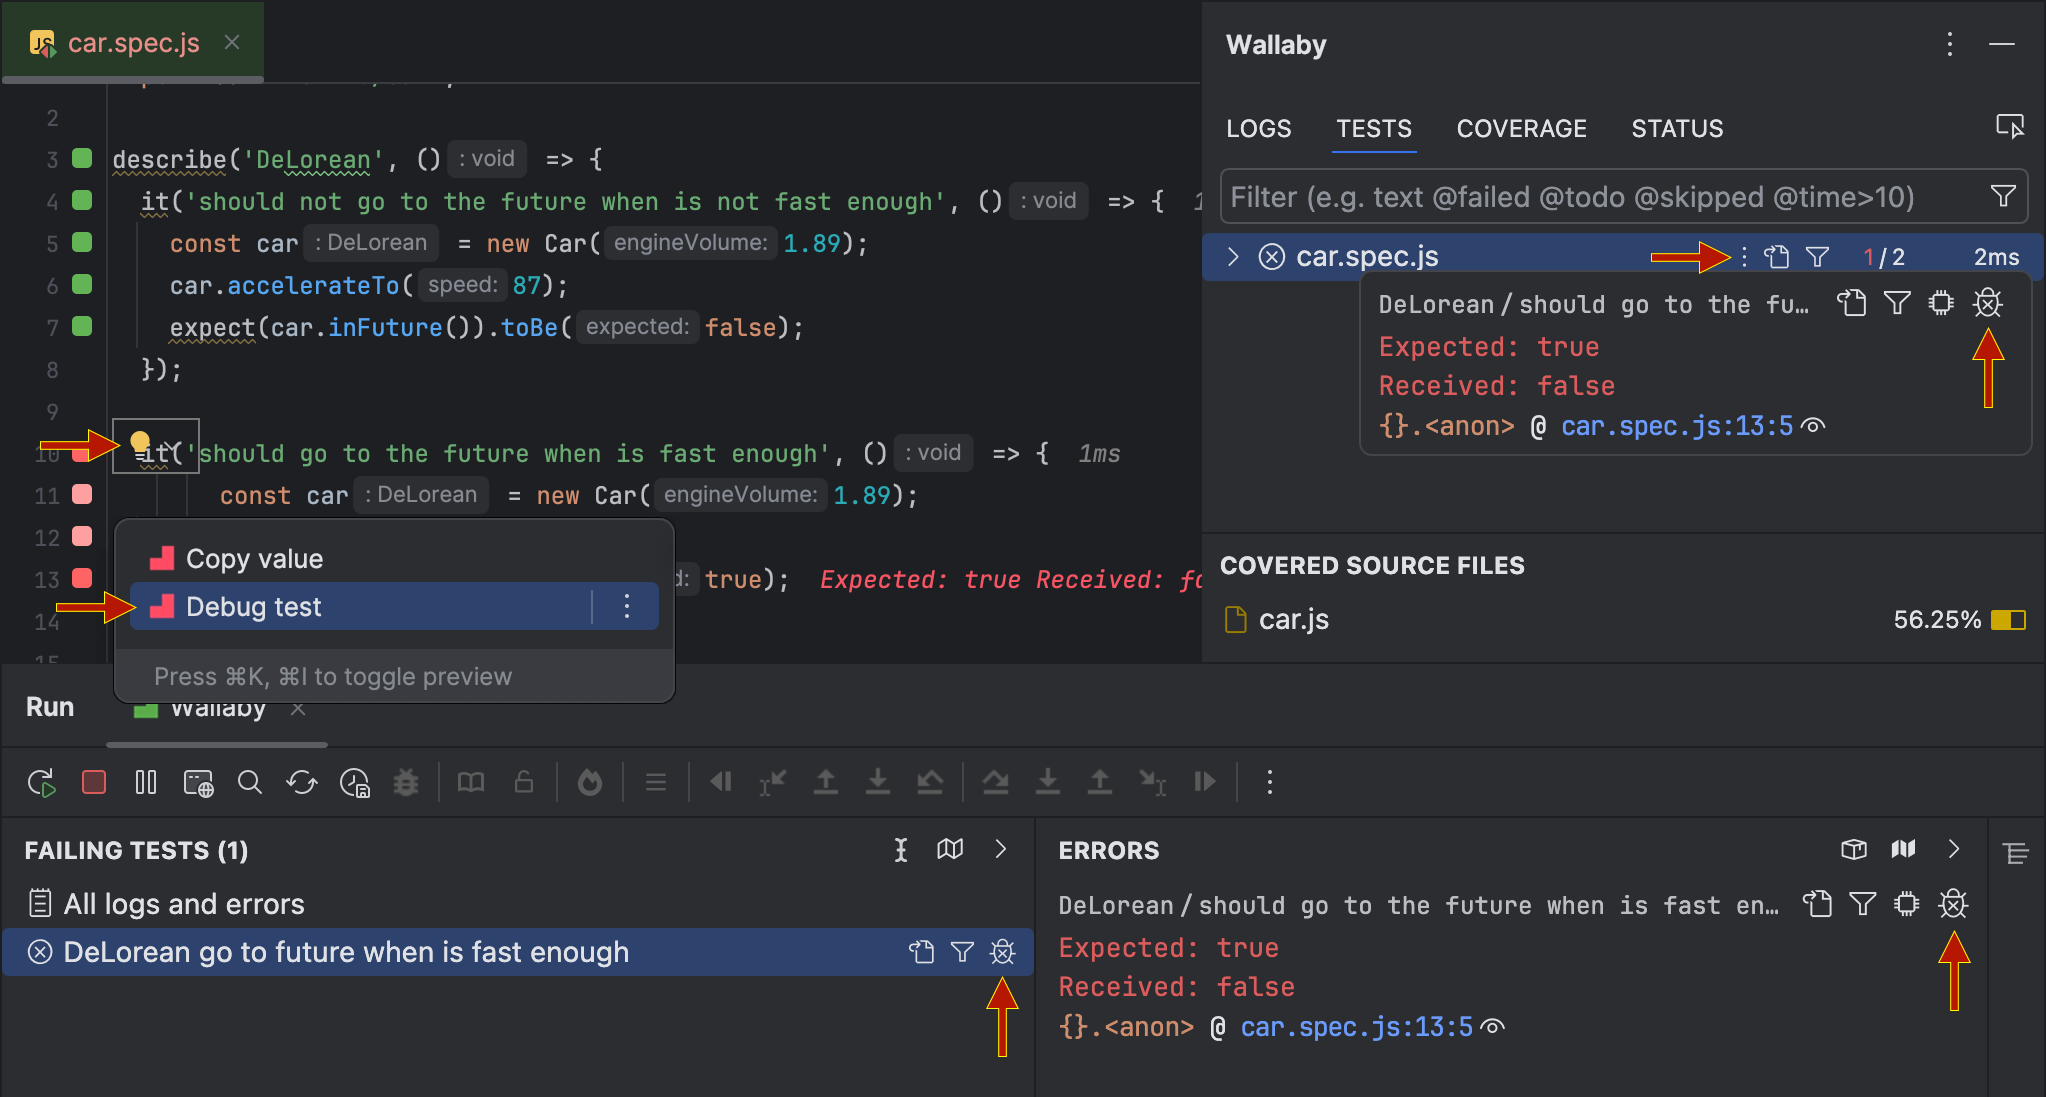
- at any covered line (whether in a test file or in code called by a test) by running the
Debug testintention action,Start Debuggeraction, or by clicking on the debug icon in the IntelliJ Run Tool Window. When a line is covered by multiple tests, you will be prompted to select which test to debug. - at the beginning of a failing test by clicking the debugger icon next to an entry in the the Overview panel’s
Failing TestsorErrorsviews - at the beginning of any test by clicking the debugger icon while hovering over the
⋮icon next to the test in theTesttab of the Side View
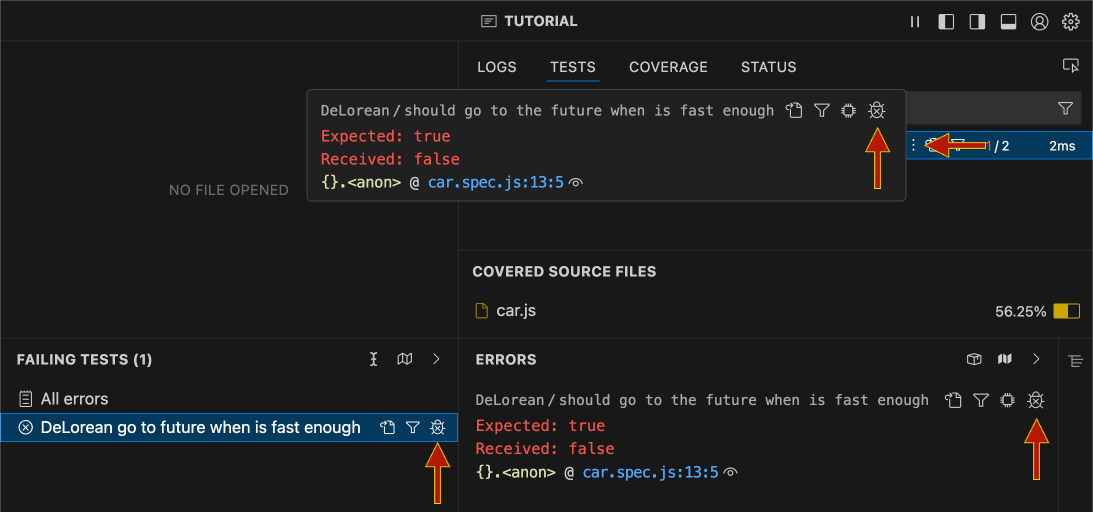
- at the beginning of a failing test by clicking the debugger icon next to an entry in the the Overview panel’s
Failing TestsorErrorsviews - at the beginning of any test by clicking the debugger icon while hovering over the
⋮icon next to the test in theTesttab of the Side View
Debugger View
When the debugger is running, the Overview panel will change in a number of ways:
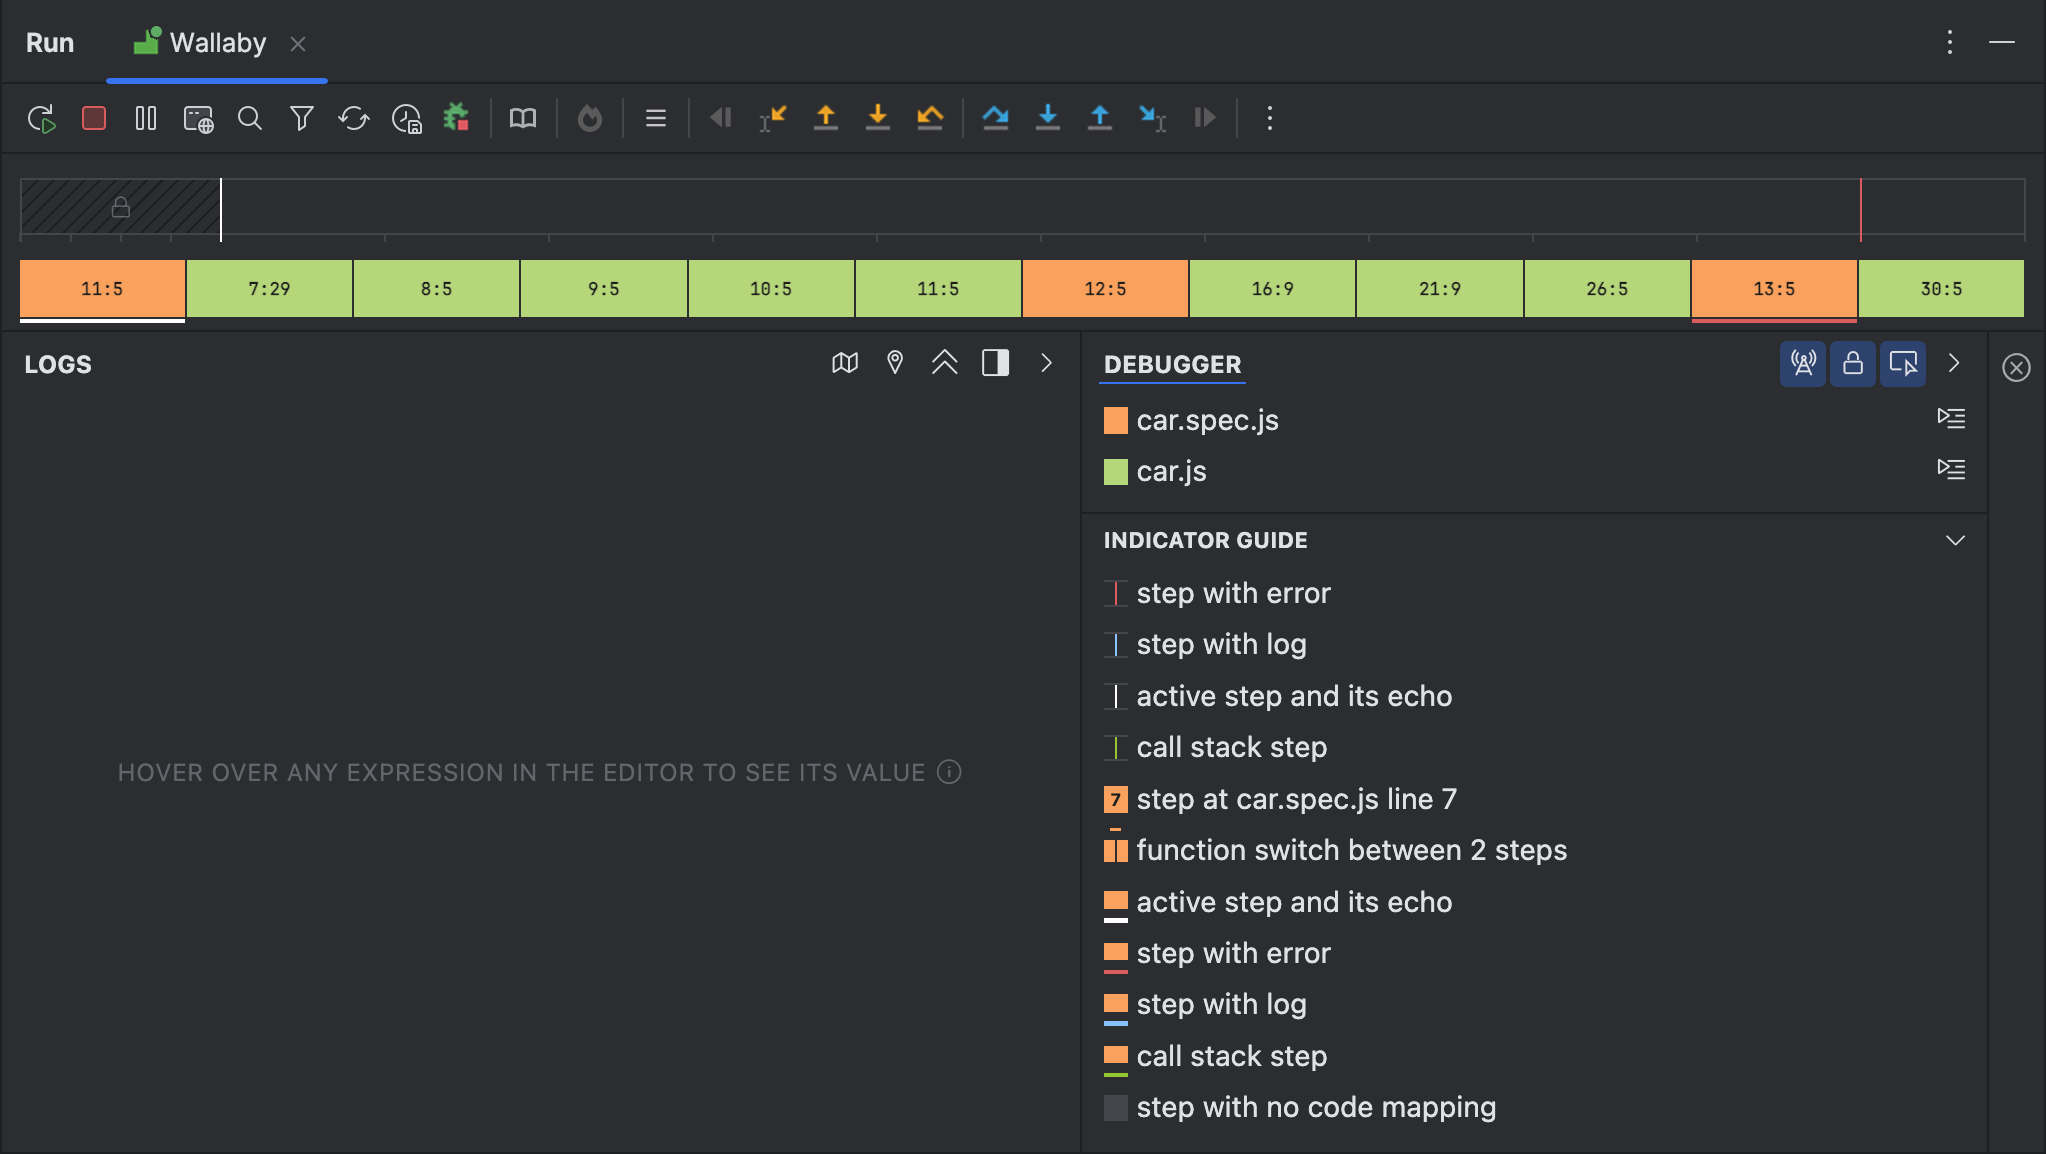
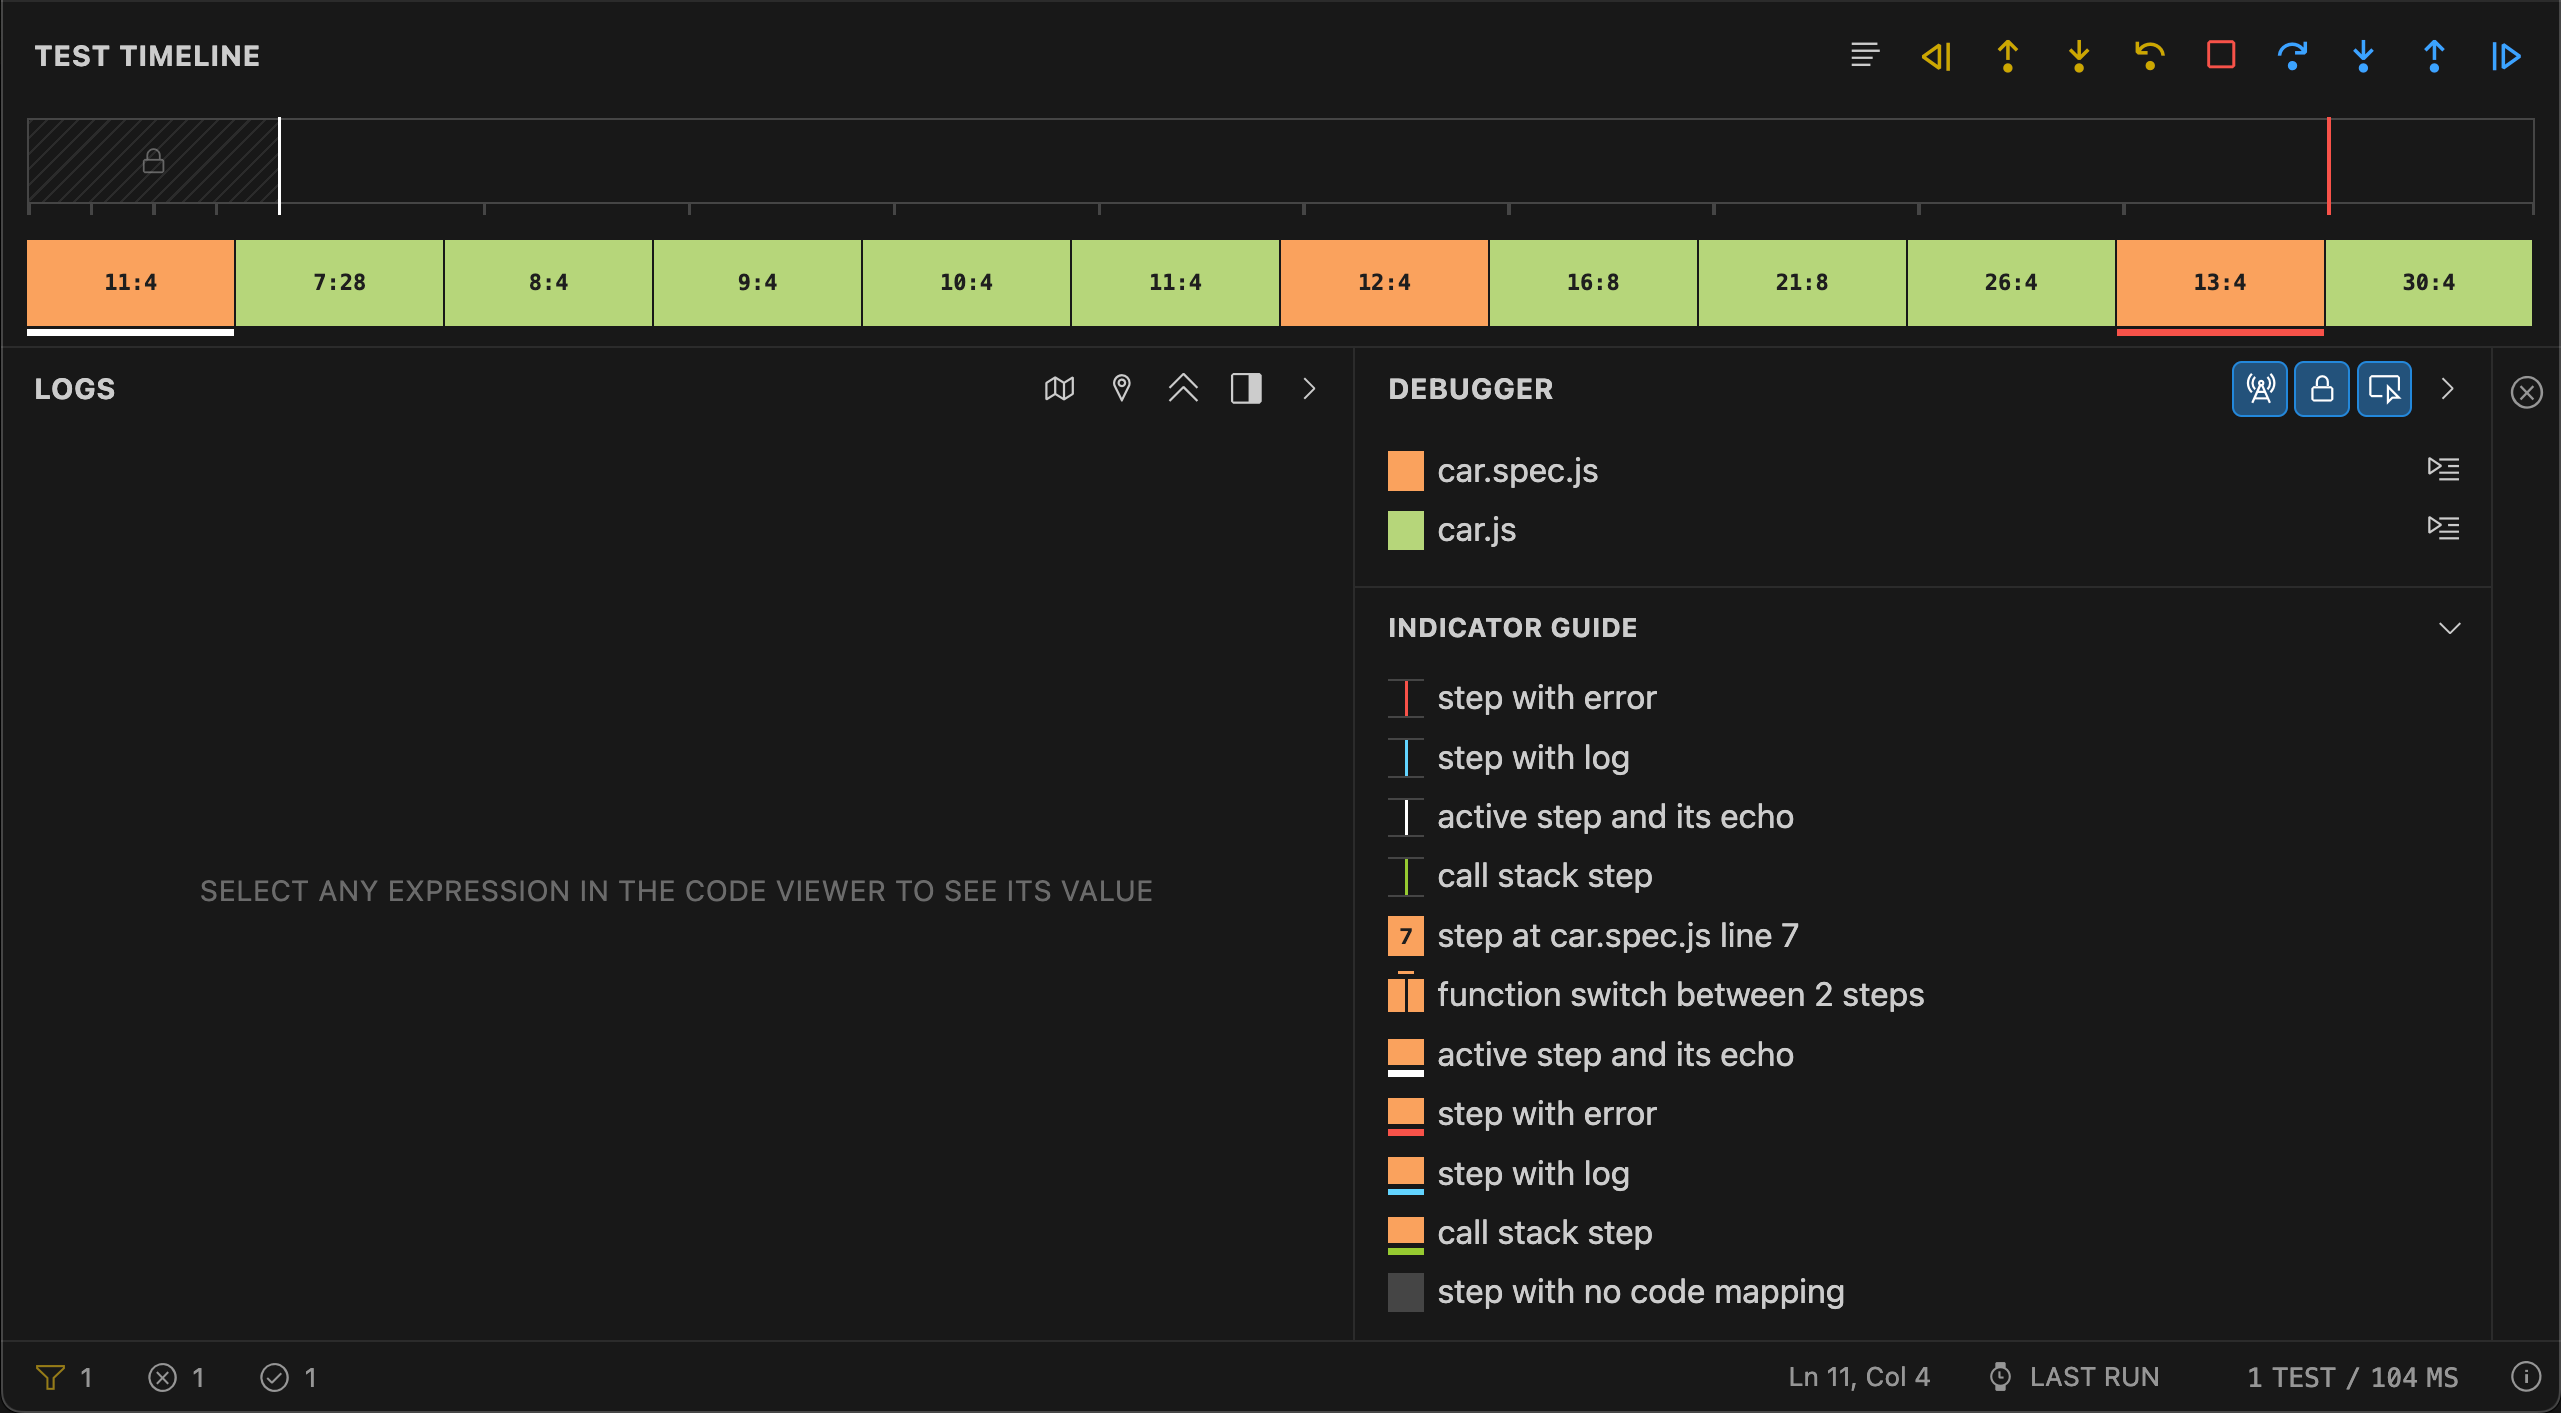
- The
Logssection will behave differently and theWatch Expressionssection will become available - The
Failing Testssection will be hidden - An Interactive Timeline will appear at the top of the panel
- The
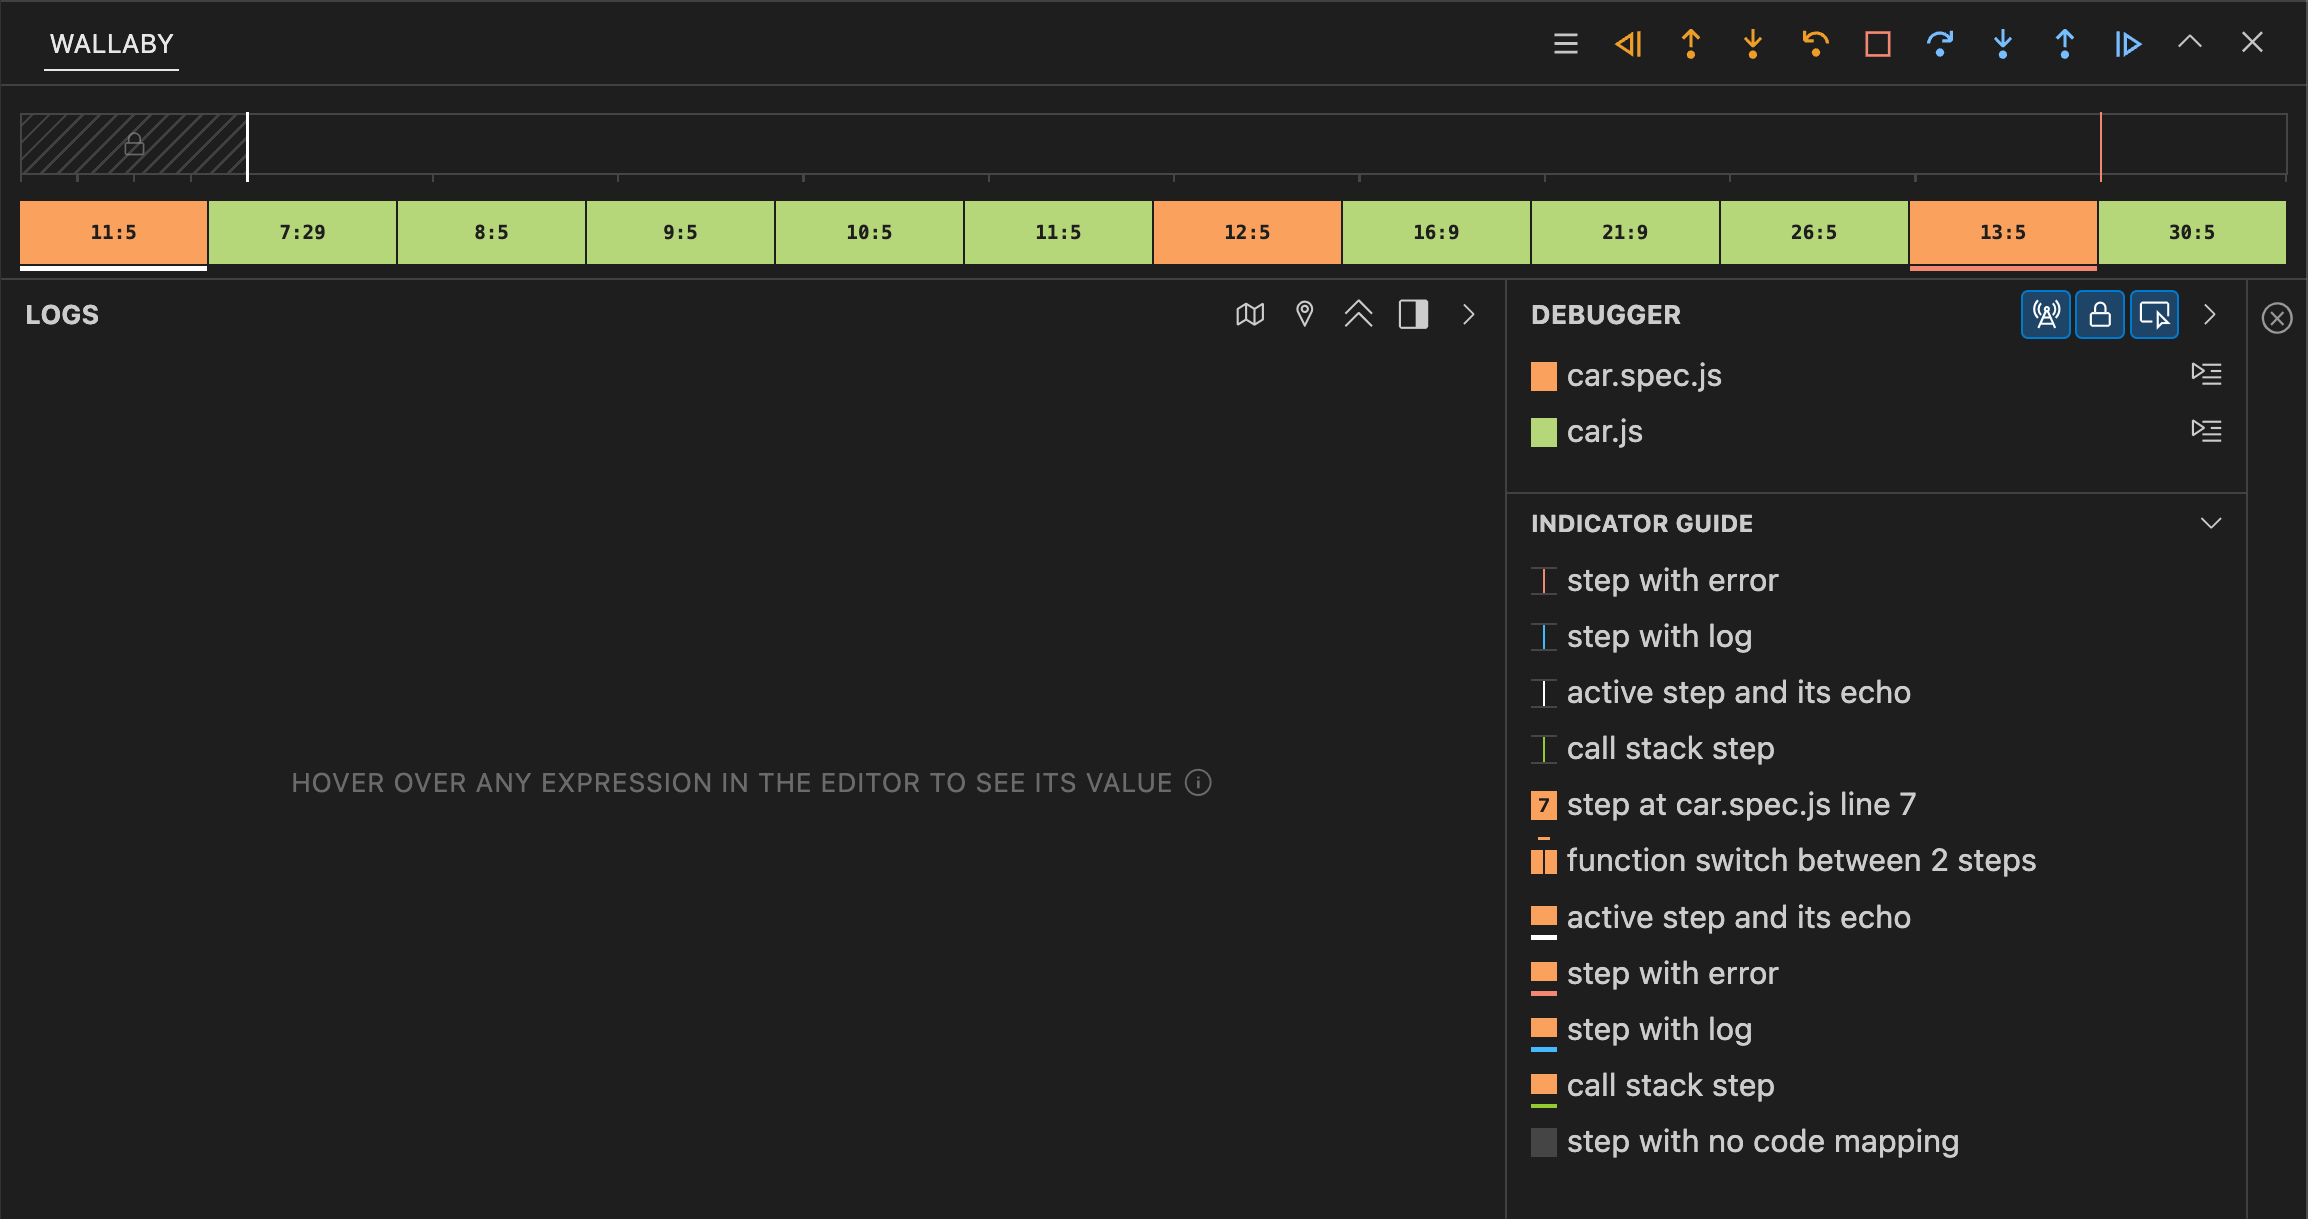
Debuggerpanel will become available, providing a color-coded guide that can be used to identify files in the timeline - An
Indicator Guidewill become available, providing information about the indicator colors within the timeline
A set of navigation icons will also appear in the main Wallaby panel header (above the Overview panel), providing the ability to control code execution within your debugger session.
The expanded/collapsed state of the different sections of the Overview panel will be remembered between debugger sessions.
Interactive Timeline
The Interactive Timeline is a visual representation of your code’s execution steps. The timeline is highly optimized to work with large test suites and complex codebases. The appearance of the timeline may change depending on the number of steps that were recorded when executing your tests.
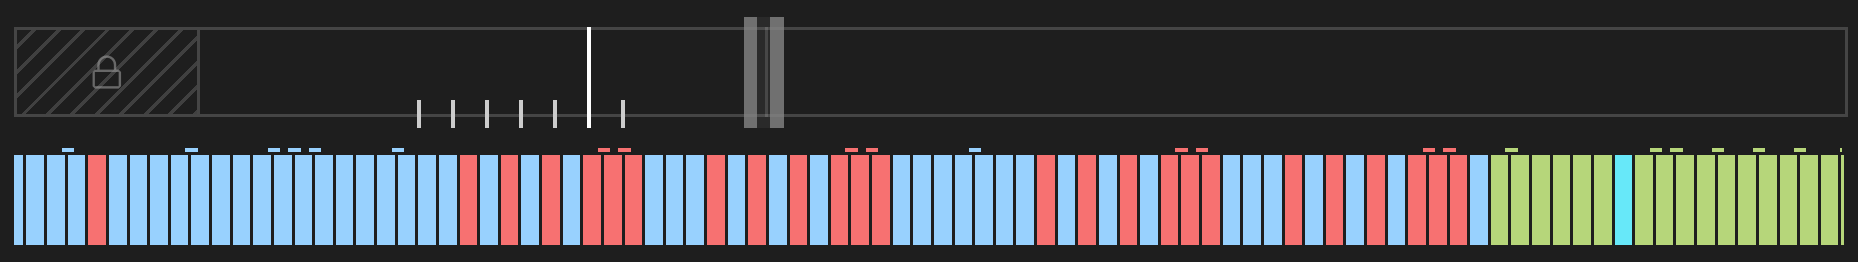
The interactive timeline is divided into two main sections: the Timeline and the Steps view. The Timeline provides an end-to-end view of your test execution, while the Steps view provides a more detailed view of individual steps that were executed.
You can click on the timeline, or a step to navigate to a different point in your test execution. When notches or indicators are visible, the timeline will snap to the nearest notch or indicator to make navigation easier.
Some steps will be marked with a colored indicator that provides additional helpful information to assist you with debugging. The Indicator Guide in the bottom right of the Overview panel explains what the colors mean, and will be updated for your codebase:


Timeline Navigation and Zoom
When a larger number of steps are recorded, the Timeline will include a resizeable “window” that controls how the Steps view (located immediately underneath the Timeline) is displayed. This window can be moved by dragging the top of the window left or right, and can be expanded or contracted by dragging the ends of the window left or right. It can also be expanded or contracted by using the mouse wheel anywhere over the Timeline or Steps, effectively zooming in or out.
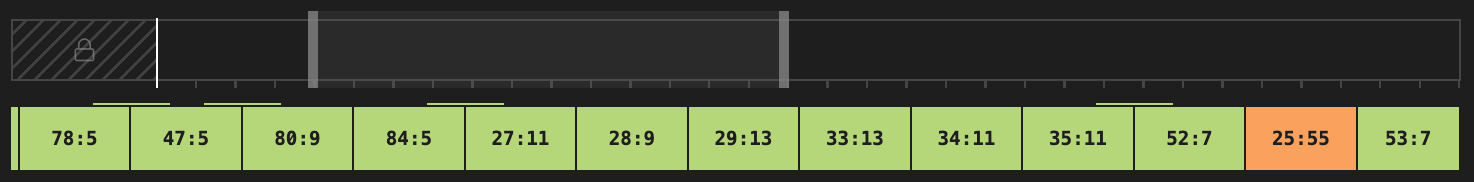
When enough visual space is available, the Step view will display the line and column of the current step, and the step will be colored based on the file it is in (the Debugger panel describes the different colors for your files).
If sufficient space is available, when you hover over a step, you will see a preview of the code for that step and its surrounding context. This behavior can be toggled on/off with the Toggle code preview display button
in the Debugger panel.
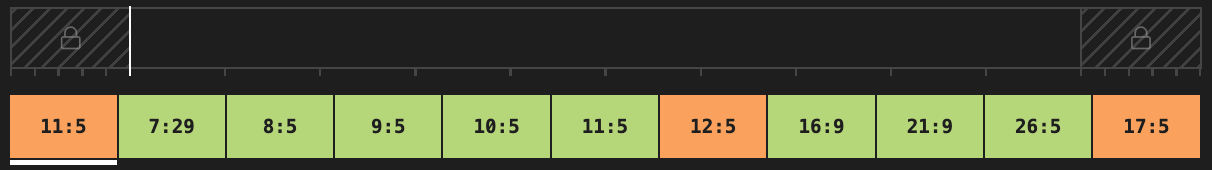
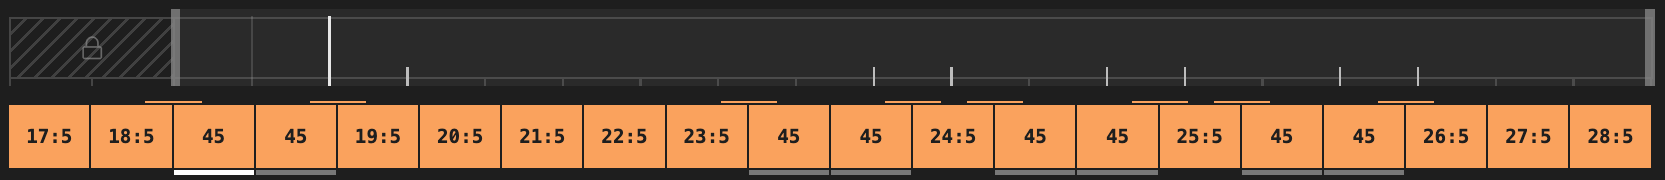
Pre- and Post-Test Steps
If your tests include pre- and post-test steps (e.g., beforeAll, afterAll), they will appear collapsed by default in
the timeline, with a fixed size to allow more space for displaying the test steps. To view these steps in more detail,
you can toggle the Make pre/post test sections use common scale (lock icon) button in the Debugger panel to display these steps at the same scale as your test steps.
Echo Steps
Echo steps provide a visual representation of other steps recorded for your test execution for the same line / branch
of the current step in the debugger. Echo steps may be useful when you want to see where else the current
line of code has been executed during the test, and navigate to those steps. Echo steps can be toggled on/off
with the Show/Hide current step echo button in the Debugger panel.
Note that number of echo steps reported is limited to 100 steps in each direction.
Logs View, Watch Expressions
While the debugger is active, the Logs view will show only logs related to the current test. Additionally, a new section,
Watch Expressions will appear at the top of the Logs panel.
Watch Expressions can be added in a number of ways:
- by hovering over a value
- by hovering over a selection (allowing precise control)
- by using the
Show Valuecommand
Watch Expressions can be added in a number of ways:
- by hovering over a value
- by hovering over a selection (allowing precise control)
- by using the
Show Valueaction or intention action
Watch Expressions can be added by selecting a value in the editor view provided by Wallaby UI in your browser.
Watch Expressions can be explored, copied, refreshed, or removed using the icons in the Watch Expressions section.
Values will appear in your editor like regular logs.
When working with nested expressions (e.g. myObject.a.b.c), you do not need to select the entire expression (selecting only b will output myObject.a.b).
Watch Expressions will be updated when the active step changes but can only display values for steps up to (i.e. at or before) the active step.
Debugger Panel
The Debugger panel, located in the top right of the Overview panel, provides a color-based legend for files involved
in the active debugger session. The steps in the Steps view use these colors to indicate which file a step belongs to. Icons on the right of the Debugger View
can be used to navigate directly to the first line of code executed in that file as part of the debugged test.
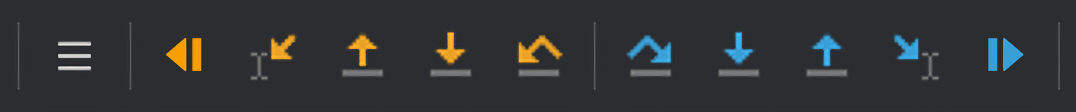
Debug Actions
Debug Actions are available from the Debugger file actions and Debugger View header, as well as via keyboard shortcuts.
Debug Actions are available from the header of the Wallaby Run Tool window as well as via keyboard shortcuts. Keyboard shortcuts may be remapped in your IntelliJ Editor’s Settings.
Debug Actions are available from the Debugger View header.


Show Call Stack
Shows the call stack for the current step. The stack will be displayed in the Debugger panel instead of the legend and indicator information (until closed).
Run Back to Breakpoint Ctrl + F8
Runs backwards from the current debugger step and stops when a breakpoint is encountered.
Run Back to Breakpoint Alt + Shift + F9
Runs backwards from the current debugger step and stops when a breakpoint is encountered.
Run Back to Active Line Ctrl + F5
Run Back to Active Line Alt + Shift + F6
Run Back to Active Line
Runs backwards from the current debugger step to the line of code where the cursor is currently positioned.
Step Back Out Ctrl + Shift + F11
Step Back Out Alt + Shift + F8
Step Back Out
Returns back to the line before the current function was called.
Step Back Into Ctrl + F11
Step Back Into Shift + F7
Step Back Into
If the line does not contain a function it behaves the same as “Step Back Over” but if it does the debugger will enter the function and continue line-by-line debugging there.
Step Back Over Ctrl + F10
Step Back Over Shift + F8
Step Back Over
Steps backward over a given line. If the line contains a function the function will be executed and the result returned without debugging each line in the function.
Start/Stop Debugger Shift + F5
Start/Stop Debugger Alt + F5
Start/Stop Debugger
Starts or stops the debugger.
Step Over F10
Step Over F8
Step Over
Steps forward over a given line. If the line contains a function the function will be executed and the result returned without debugging each line in the function.
Step Into F11
Step Into F7
Step Into
If the line does not contain a function it behaves the same as “Step Over” but if it does the debugger will enter the function and continue line-by-line debugging there.
Step Out Shift + F11
Step Out Alt + F8
Step Out
Returns to the line after the current function was called.
Run to Active Line F5
Run to Active Line Alt + F6
Run to Active Line
Runs forward from the current debugger step to the line of code where the cursor is currently positioned.
Run to Breakpoint F8
Runs forward from the current debugger step and stops when a breakpoint is encountered.
Run to Breakpoint Alt + F9
Runs forward from the current debugger step and stops when a breakpoint is encountered.
The example below shows the output of selecting operand1 on line 11 of a code file
when the current execution step is on the same line.
The example below shows the output of selecting operand1 on line 11 of a code file
when the current execution step is on the same line.
Edit-and-continue
While the Wallaby debugger is active, you can edit your code at any time and continue debugging without needing to stop or restart your session. In typical JavaScript or TypeScript workflows, changes usually require stopping the debugger and restarting, but Wallaby does not have this limitation and applies your edits instantly without you needing to restart.
Default Trace Limits
By default, Wallaby limits the number of steps that are recorded during a debug session to ensure system resources (memory and CPU) are not
adversely affected by the Time Travel Debugger feature. If required, this can be adjusted using the
maxTraceSteps setting.
Tips and Tricks
Classical Debugger vs. Time Travel Debugger
While similar to classical debugging, the ability to step forward/backward through code provides a new way to consider using a debugger.
Instead of starting the debugger at the start of your test, start at your failed expectation and use the Step Back Into command.
Breakpoints
You may use existing breakpoints in your code to pause execution at a specific line for tests / source files that are processed by
Wallaby with the commands Run Back to Breakpoint and Run Forward to Breakpoint. If you add a breakpoint in a file that is not processed by Wallaby, the debugger will not pause at that line.
You may prefer using the Run to Active Line and Run Back to Active Line commands; for a single breakpoint, these are equivalent in functionality.
Wallaby’s Time Travel Debugger does not have traditional breakpoints, you may instead use the Run to Active Line
and Run Back to Active Line commands; for a single breakpoint, these are equivalent in functionality.
Inspecting runtime values
In addition to Watch Expressions, you can also use Wallaby’s Advanced Logging features (console.log, live comments, and identifier expressions) when the current debugger step is the step with the log/comment/expression.
Unable to navigate
The Time Travel Debugger can only be used on files instrumented by Wallaby (i.e. those that have coverage gutter indicators when opened). When deciding what files to instrument, the tool respects its configuration and testing framework-specific settings (for example Jest’s collectCoverageFrom setting).
Sometimes you may select a navigation option that is unavailable (e.g. a Step Into request when on the last execution step).
When unable to navigate, the code selected by the debugger will change to a red color.
Note: in many cases, multiple execution steps may map to one displayed statement or expression due to transpilation and other testing framework behaviors.
Changing Debugger Highlight Colors
The colors used to highlight Wallaby’s Debugger context can be altered by changing your JetBrains editor settings:
- Current Execution Context: Color Scheme -> Debugger -> Execution point
- Stack Trace Line: Color Scheme -> Debugger -> Not top frame
- Unable to Navigate: Color Scheme -> General -> Popups and Hints -> Error hint