Advanced Logging
There are a number of ways to log something in Wallaby and quickly inspect the output inline, in hovers, or inside the
Wallaby Overview Logs or Side Panel Logs views:
- Logpoints - use editor breakpoints to display the value of any expression
- Value Peek - display values by hovering over them
- Live Value Display - display values with a special command
- Using console.log - log with
console.log - Identifier expressions - log by simply typing a variable name
- Live Comments - use special comments to display values
- Live Value Display - display values with a special command
- Using console.log - log with
console.log - Identifier expressions - log by simply typing a variable name
- Live Comments - use special comments to display values
Logpoints
Logpoints allow VS Code and JetBrains IDE breakpoints to be used to display the value of any expression. Using breakpoints to manage displaying values offers a number of advantages:
- No modification to source code is necessary
- They are easily added and removed using familiar keyboard shortcuts (VS Code: F9, or ⇧F9 for inline breakpoints, JetBrains IDEs: ⌘F8)
- They offer a clear visual indicator of what is being logged (especially when placed within lines as
inline breakpoints) - No debugger required (Wallaby uses the breakpoint information directly to determine what to log)
- They are managed by your editor, and will persist when files are closed and reopened
- They can be added to classes and functions to log all lines within them
Value Peek
Value Peek provides another way to quickly inspect values without modifying your code. When enabled, hovering over any
expression or selection will evaluate, capture, and display the associated value(s). To avoid clutter, in-editor display
and inclusion of values in Wallaby’s Logs section are suppressed by default, but can be shown by using the
Explore Value icon (to the right of the value in the hover).
Value Peek is similar to Watch Expressions, but is available when the debugger is not running, and can display values from all test execution paths simultaneously.
Live Value Display
Sometimes you may also want to quickly display some expression value, but without modifying your code. Live Value
Display allows you to do it with a special command (Show Value command/intention action, or with a corresponding
keyboard shortcut).
Note that the expression being logged either needs to be selected, or the cursor position needs to be right after the expression being logged when the command is invoked.
Note: you may use the Live Comments feature to log any expression value when you want to keep displaying the value when you change your code or restart Wallaby.
Using console.log
For those new to Wallaby, a familiar method to log values is to simply use console.log(anything). Wallaby supports
logging values with the same console.log method that you are used to.
Identifier expressions
Another simple way to log something is to just type a variable name and get its value(s) displayed:
Note that only simple identifier expressions, for example a, are automatically logged this way, but not other types of
expressions, for example not a.b or a.b(). To log other types of expressions, you may use one of the other logging
methods described in this article.
Live Comments
Values
Live Comments allow special comments to be used to display values. Inserting the special comment /*?*/ after an
expression (or just //? after a statement) will log just the value of that expression.
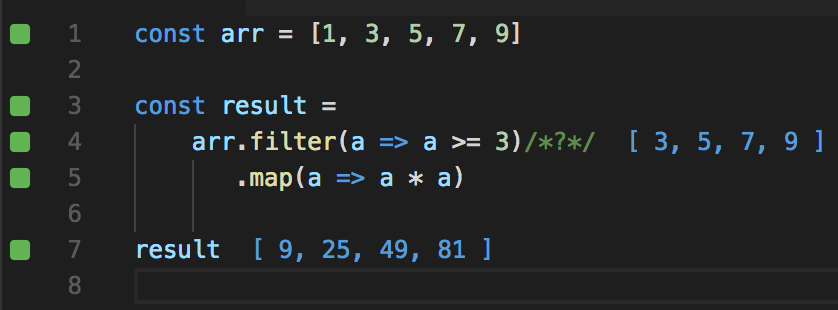
Like Logpoints, Live Comments allow you to see the value right in the middle of an expression. For
example, given a chain of a.b().c().d(), you may want to inspect the result of a.b().c() before .d() is called.
The example below shows how to log the runtime value of a.b().c():
a.b() .c() /*?*/ .d();If you want to log the full expression of a.b().c().d() then you can add a comment at the end of the expression:
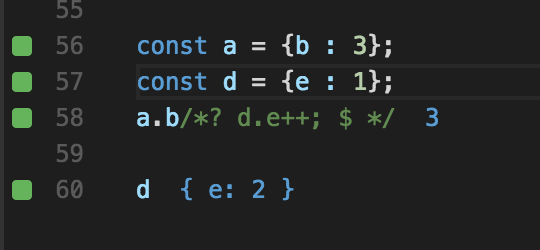
a.b().c().d(); /*?*/// or justa.b().c().d(); //?You may also write any JavaScript code right in the comment to shape the output. The code has the access to the $
variable which is the expression that the comment is appended to. The executed code is within a closure, so it also has
the access to any objects that you may access from within the current lexical environment.
Note that there are no constraints in terms of what the comment code can do. For example, the watch comment below is
incrementing d.e value, and returning $, which points to the expression that the comment is appended to (a.b).
Logpoints, Live Comments, and Live Value Display (but not console.log) also have some built in smarts to help
with logging certain data types. For example, when you place the comment after an expression that is a promise, the
resolved value of the promise is logged. Or, if an expression is an observable, then its values are displayed.
Note that the special logging comment feature (as well as the Performance Testing one) will not work in most cases for CoffeeScript code due to the CoffeeScript compiler limitations.
Live comment snippet
To save some time typing the comment when you need it, you may:
- create a code snippet in VS Code with a custom keybinding,
- create a live template in JetBrains IDEs,
- create a code snippet in Sublime Text with a custom keybinding,
- create a code snippet in Visual Studio.
Object proxy
The feature allows you to wrap any selected object value with JavaScript Proxy to quickly see where the wrapped object properties are being accessed from and what values are returned/set, and also where the wrapped object functions are called from and what values are returned from the object functions.
Inserting the special comment //?? (or /*??*/) after any expression will wrap the runtime value of the expression
with recursive proxy (if the value of the expression is an object). The results of intercepting the object’s
properties and functions can be viewed in the Overview Logs or Side Panel Logs views.
Depending on how the wrapped object is used in your code, the following nodes can be displayed under the Accessed Members node of the object’s value in Wallaby’s Overview Log and Side Panel Log:
- property read node with
GETlabel and the value of the property being read, - property write node with
SETlabel and the value being assigned to the property, - property delete node with
DELETElabel and the value of the property when it was deleted, - function call node with
CALLlabel and the value returned from the function.
Under each intercepted property/function node there is a Call Stack node that can be used to find out where exactly in your code the property was accessed from or the function was called from.
Please note that in order for an object’s properties and functions to be intercepted, the object proxy live comment must be applied to an identifier prior to its use (e.g. variable declaration, method parameter). Applying the object proxy to an identifier expression alone will not intercept subsequent usages of the object.
  // this will intercept all accessed members of "myInterceptObject"  const myInterceptedObject = getComplexObject(); //??
  // this will intercept all accessed members of "myComplexObject"  // within the function "interceptUsagesInThisFunction"  interceptUsagesInThisFunction(myComplexObject/*??*/);
  // this will NOT intercept any accessed members  const myInterceptedObject = getComplexObject();  getComplexObject(); //??
Performance Testing
The feature also allows you to quickly see how various parts of your code perform. It can be very helpful for identifying possible bottlenecks in your app and for doing the performance optimization.
Inserting the special comment /*?.*/ after any expression will report how much time it took to execute the
expression.
Adding the comment to an expression that gets executed multiple times, for example inside a loop, will make the tool to display total execution time, average execution time (total execution time divided by number of times the expression had been executed), minimum and maximum execution time.
Execution time and result via a single comment
You may also use the execution time reporting comment and add to it any expression that you may use in live comments to display both an expression execution time and execution result.
For example,
a(); //?. $displays a() execution time and result.
Configuration
The watch comment prefix default value (?) can be changed in wallaby config file. For example, to make the watch
comment to be /*out:*/, you may do:
module.exports = function (wallaby) {  return {    ...
    hints: {      commentAutoLog: 'out:'    }  };};
Auto-Expanding Logged Values
By default, Wallaby limits how much of an object is logged and displayed in the Overview Logs and Side Panel Logs to
prevent performance issues.
You may expand objects in the Overview Logs and Side Panel Logs views by clicking on the object in the log. When you
do this, Wallaby will retrieve additional properties and display them in the log.
Identifier expressions and
Live Comments can be provided with an additional hint to automatically
log objects with additional properties. Inserting the special comment //?+ after any expression will expand your
object and its properties within the Overview Logs and Side Panel Logs views.
Note that automatically expanded objects have the following limitations:
- Cyclic Dependencies are not automatically expanded
- Functions are not automatically expanded
- Strings beyond 8192 characters are not automatically expanded
- Only the first 100 properties on a single object will be expanded
- Only the first 100 elements of an array will be expanded
- Only the first 10 levels of nested properties will be expanded
- Only the first 5000 properties across all objects will be expanded
Automatically expanded objects also resolve property getters, so in case of
var a = {  get b() {    return 1;  },};
a; //?+
the output will be { b: 1 }.
Show Value / Copy Value / Show Timing(s)
Wallaby provides two commands that allow you to quickly get the value of an expression without changing your code:
Show Valuedisplays the value of your expression in your code editor right beside the expression, and will allow you to explore the value in theOverview LogsandSide Panel Logsviews.Copy Valuedisplays the value of your expression in your code editor right beside the expression AND expands the value and copies the value to the clipboard. LikeCopy Value, you may explore the value using theOverview LogsandSide Panel Logsviews.Show Line Value(s)is available for VS Code and JetBrains editors and will output the same asShow Valuefor the selected line(s) as if you had selected the entire line to display.Show Line Timing(s)is available for VS Code and JetBrains editors and will output Execution time for the selected line(s) as if you had used the//?.comment for the line.
Show Valuedisplays the value of your expression in your code editor right beside the expression, and will allow you to explore the value in theOverview LogsandSide Panel Logsviews.Copy Valuedisplays the value of your expression in your code editor right beside the expression AND expands the value and copies the value to the clipboard. LikeCopy Value, you may explore the value using theOverview LogsandSide Panel Logsviews.
Please note: Copy Value expansion has the same limitations as
Auto-Expanding Logged Values.
Resolve property getters
Automatically expanded objects (logged with the special comment //?+) resolve property getters. If you want to always
resolve property getters regardless whether the logged object is automatically expanded or not, you may
use the resolveGetters configuration setting.