Neovim, Zed, Emacs, etc.
Wallaby Standalone Mode, also known as Wallaby for any editor, allows you to use Wallaby with any editor without the need for an editor extension. This mode is perfect for editors like Neovim, Vim, Zed, Emacs, and more. To get started, simply run in your project’s root directory:
npm install -g @wallabyjs/cliwallabyYou can then start modifying your project’s code in your editor, and Wallaby will automatically run your tests and display the results in real time in the opened browser window when you save your changes (or your editor automatically saves them).
Overview Panel
Wallaby introduces a cohesive and integrated Overview panel, providing a centralized hub for all ongoing tactical testing activities, such as analyzing failing tests, exploring errors and logs, and debugging.
At startup, Wallaby’s Overview panel offers clear progress indicators and time estimates, giving you an immediate sense of what to expect. You can quickly assess the current status and troubleshoot any issues that arise, ensuring a smoother workflow.
Tests
Overview Tests focuses on the most important tests (failing, focused, or even tests covering a current/specific line of code), so you can concentrate on what truly matters without being overwhelmed by unnecessary details.
Errors
Overview Errors make it easy to explore values directly from the editor context, simplifying the process of diagnosing and fixing issues as they occur.
Wallaby provides actions to navigate through error-related code, debug and profile failing tests, view diffs and stack traces, all while previewing the related code. This comprehensive approach helps you quickly diagnose and resolve issues.
Logs
Wallaby offers convenient ways to log values in real-time, such as adding console.log statements or special comments to your code.
Wallaby provides a comprehensive view of your code logs, updated in real time as you make changes to your code, ensuring you never lose context. It also features indentation guides and unlimited expand/collapse functionality for faster navigation through the nested structure of your objects. By combining the best aspects of tree and text representation models, logs are more readable, and each log entry includes contextual information, helping you quickly understand where it’s coming from.
Code Viewer
All navigation and interaction with Wallaby UI is available directly in the browser window, and code navigation and code preview are available in the Wallaby UI Code Viewer.
Code Coverage
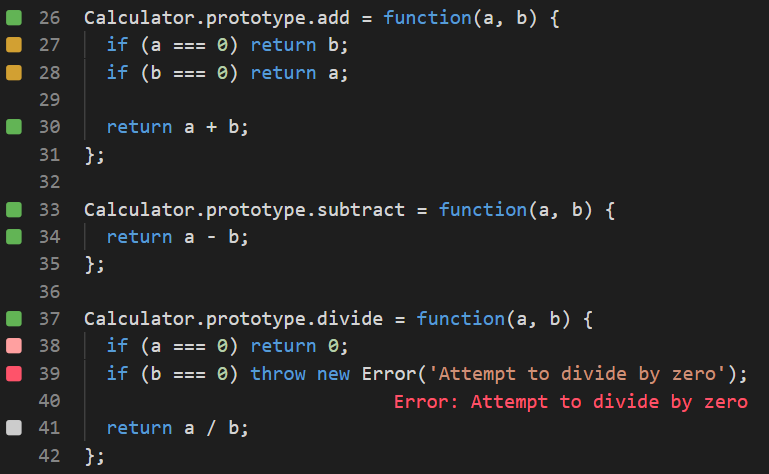
Wallaby calculates code coverage as it runs your tests, showing which parts of your code have been executed and which haven’t. Coverage is displayed in the left margin of your editor and updates in real time as you make changes. Coverage indicators are more than just a report—they help you continuously verify that your code changes are affecting the right parts of your source code.
Debugging
Wallaby Time Travel Debugger allows you to step through your code, see variable values, and even change code while debugging.
The debugger timeline offers a zoomable view of test execution, helping you quickly identify key stages like setup, imports, execution, and cleanup. It shows transitions between files, functions, and lines, highlighting markers, logs, and errors with their locations, along with past and future hits for the current line - giving valuable context for debugging.
Debug Actions are available from from the Debugger file actions and Debugger View header, as well as via keyboard shortcuts.
You can explore values while debugging using watch expressions. Simply select a variable or expression in Wallaby code viewer to add it to the watch list. The watch expressions are persistent, auto-updated, and can be re-evaluated at any time if needed.
Side View
While the Overview panel focuses on short-term testing tasks, the Side View is dedicated to strategic operations, offering a real-time overview of all tests, coverage, logs, status, and more.
Tests
The Tests tab offers a test-centric overview and analytics for your project. The test tree displays all your tests in real time, with filters to focus on failing tests, long-running tests, or tests marked as “todo” or skipped. The selected test or file also shows the source files covered by the test, including test coverage metrics.
Coverage
The Coverage tab provides a file-centric overview and analytics for your project. It combines an annotated project file tree with a sortable list of files in selected folders/modules. This allows you to browse the tree structure, see aggregated coverage values, and easily identify the least-covered files, regardless of folder depth. You can also select individual files to view their code coverage.
Logs
The Logs tab is similar to the overview panel logs but designed for larger logs or more log entries. You can open it from the overview panel when you need more vertical space to explore and focus on specific log entries.
Status
The Status tab helps you quickly assess the current execution status and troubleshoot issues. For instance, if a test is taking too long, you can easily identify it and take necessary actions to address the problem.
Keyboard Shortcuts
Wallaby provides quick access to keyboard shortcuts documentation in both the Overview and Side view panels. Simply press the ? key while focused on either panel to display a comprehensive list of available shortcuts. This feature helps you navigate and interact with Wallaby’s interface more efficiently, making it easier to access various functionalities without reaching for the mouse. The shortcuts help overlay remains visible until you press Escape to dismiss it, allowing you to learn and reference the shortcuts at your own pace.