Test Profiler
Wallaby’s Test Profiler allows you to quickly record a test’s CPU usage profile to analyze its runtime performance. The feature is available for Chrome and Node test environments.
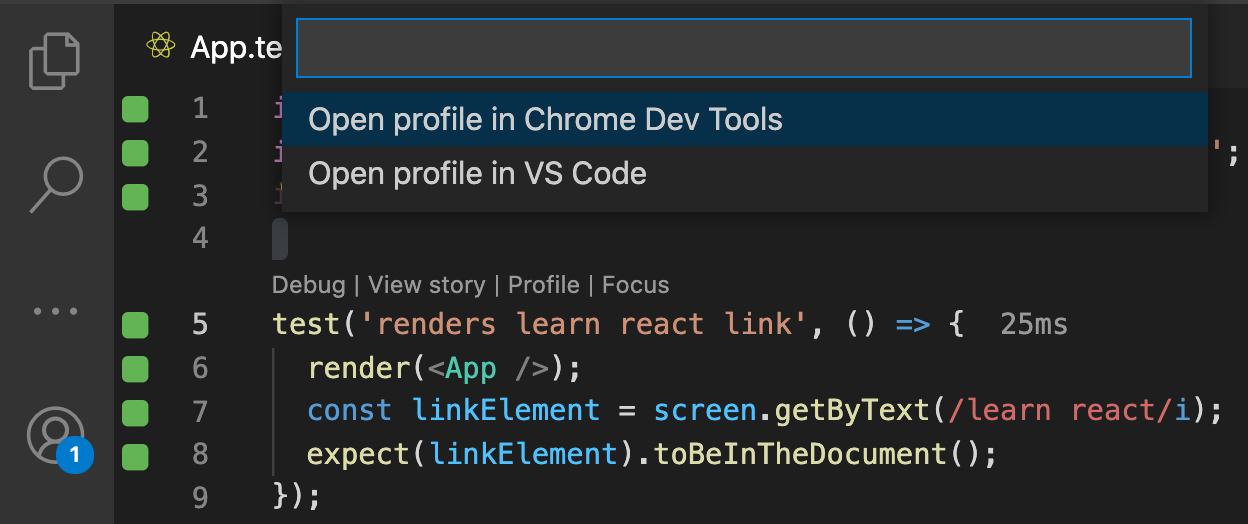
To record and view a test profile, you may use the Profile code lens, or run the Wallaby.js: Profile Test command for any line of your test. If you run the command from a line of code that is covered by multiple tests, you will be prompted to select which test you want to profile.
Before the profile is displayed, you may choose where to display it: in Wallaby Chrome Dev Tools or directly in VS Code.
VS Code embedded view
If you select to open the test profile in VS Code, then it will be displayed with VS Code’s built-in CPU profile table extension (and optional Flame Chart extension).
To record and view a test profile, you may run the Profile Test action, or the Profile Test intention action for any line of your test. If you run the command from a line of code that is covered by multiple tests, you will be prompted to select which test you want to profile.
To record and view a test profile, you may run the Profile Test command for any line of your test. The recorded test profile will be automatically displayed in Chrome Dev Tools once it is ready.
Wallaby Chrome DevTools
If you select to open the test profile in Wallaby Chrome DevTools, three views for analyzing the results are provided once the DevTools app is opened. Each view gives you a different perspective on the executed functions:
After recording a test profile, Wallaby Chrome DevTools will be opened and the test profile will be displayed with three views for analyzing the results. Each view gives you a different perspective on the activities:
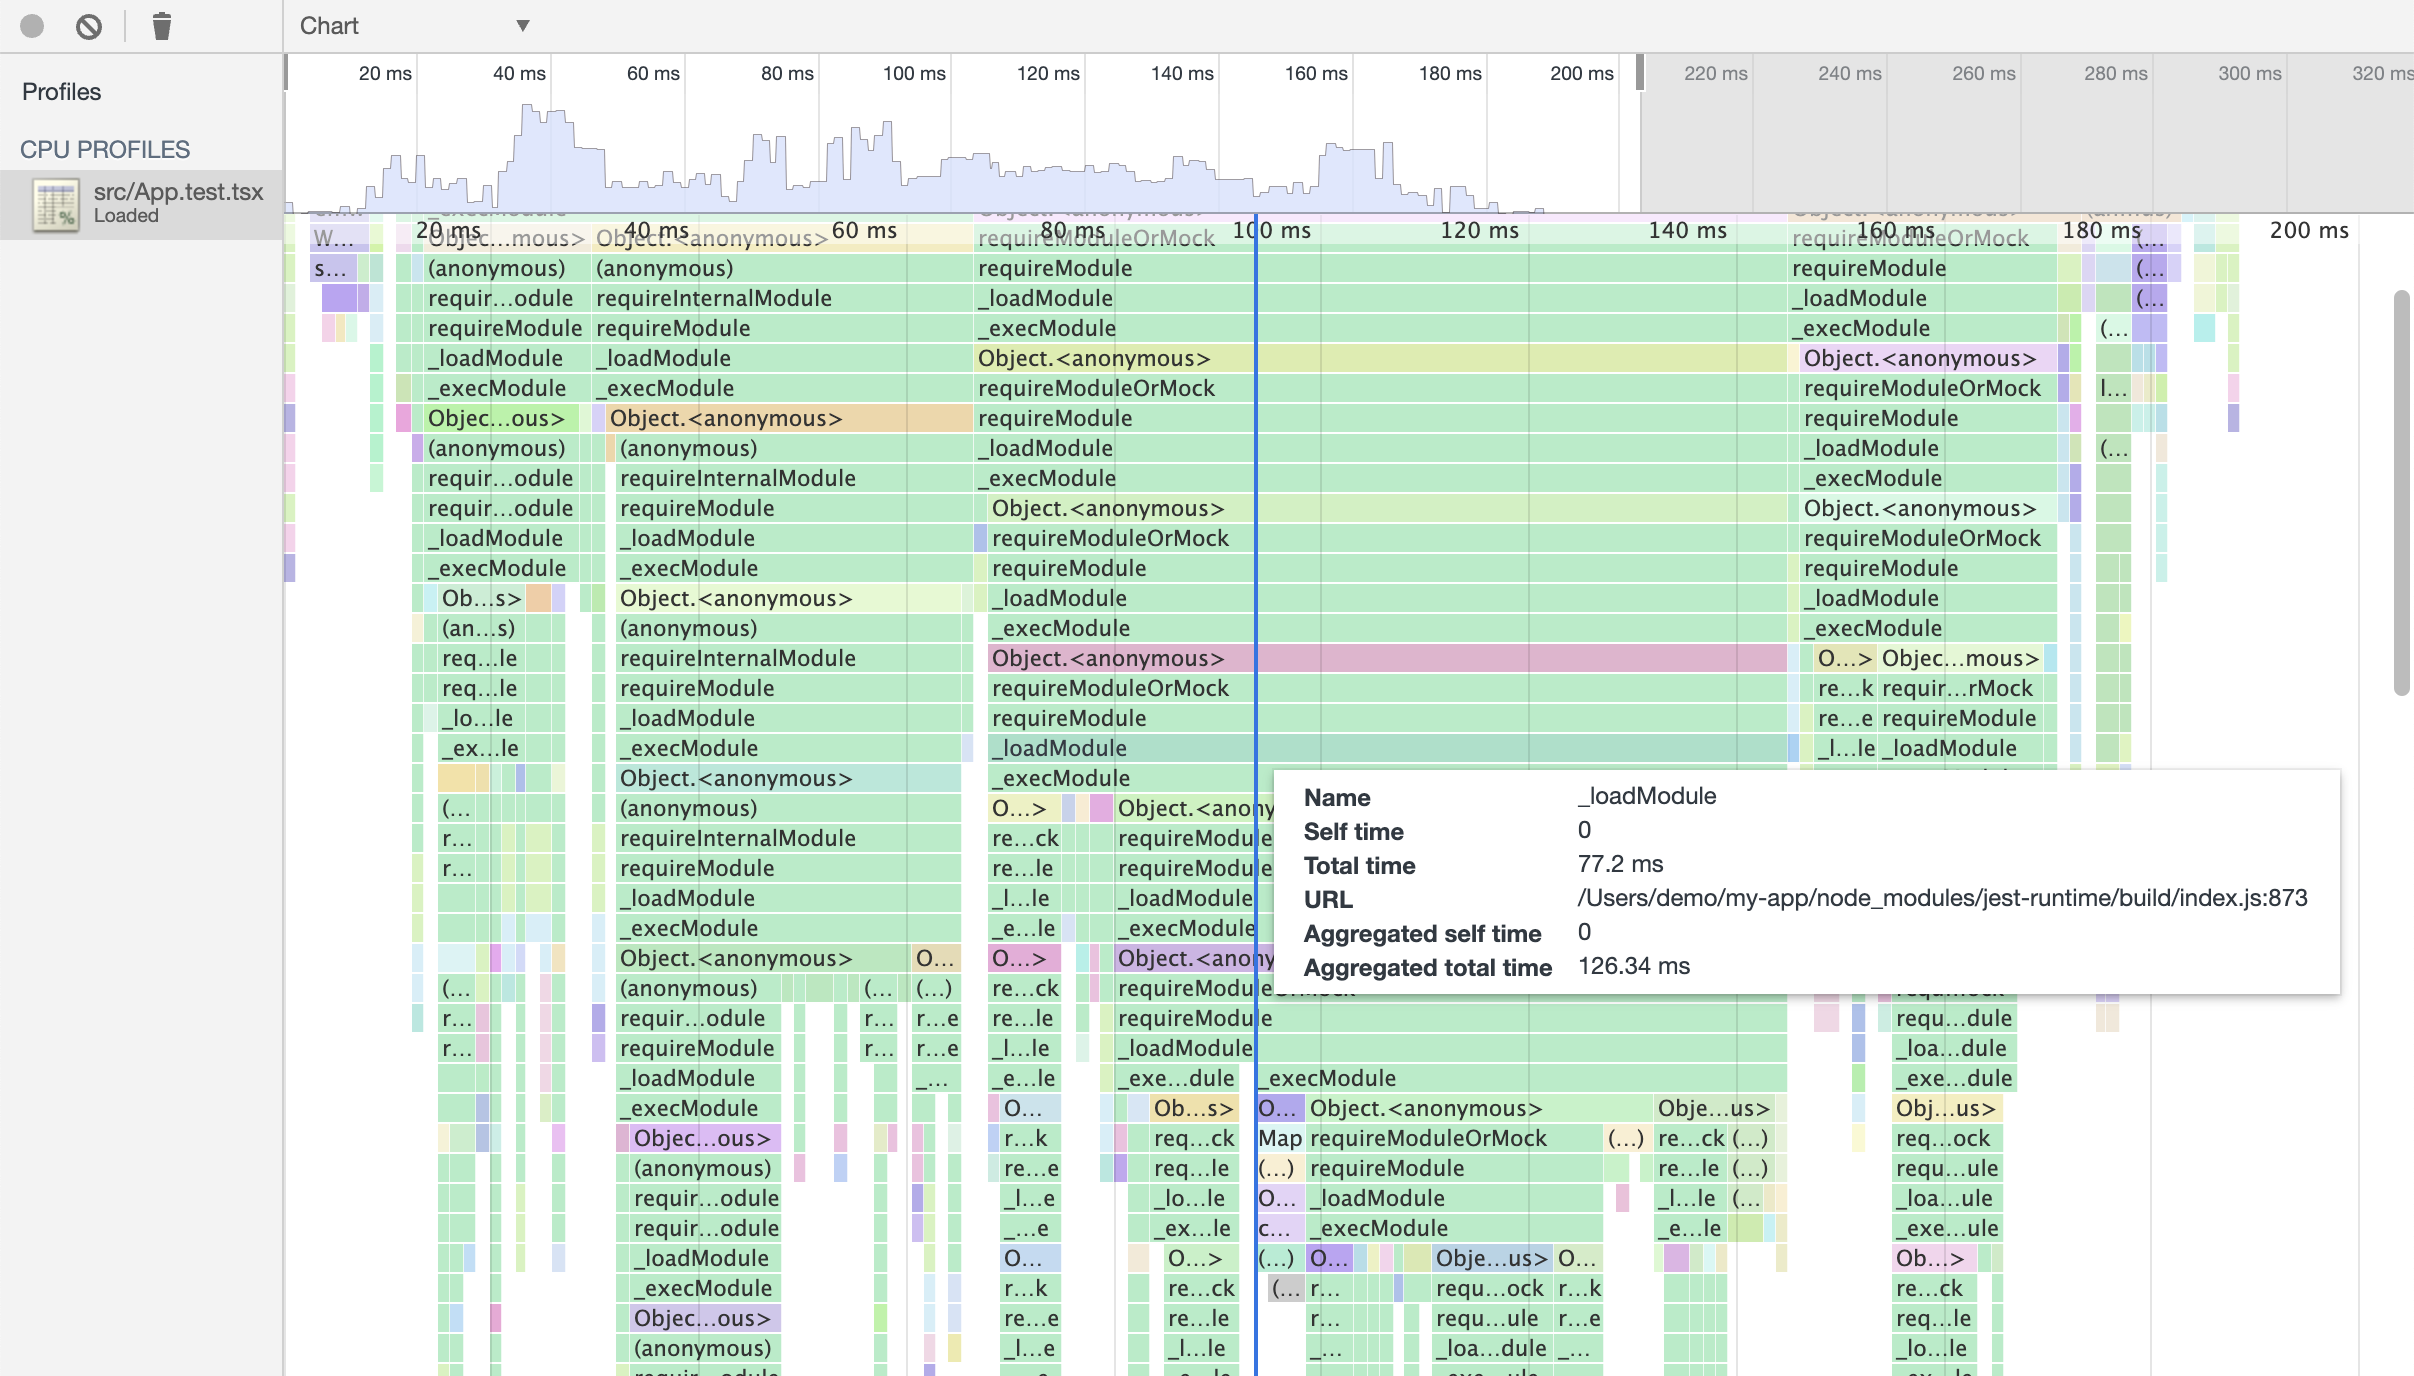
- Chart view (opened by default),
- Tree (Top Down) view,
- Heavy (Bottom-Up) view.
You may search for a specific function, file, or other text in the DevTool views using Cmd + F or Ctrl + F. In addition, any links that are provided that reference your project files will be opened in your editor when you click them.
The Chart view represents main thread activity with a flame chart. The x-axis represents the recording over time. The y-axis represents the call stack. The functions on top invoke the functions below.
You may use the Tree (Top Down) tab to view which functions cause the most work, or the Heavy (Bottom-Up) tab to view which functions directly took up the most time in aggregate.
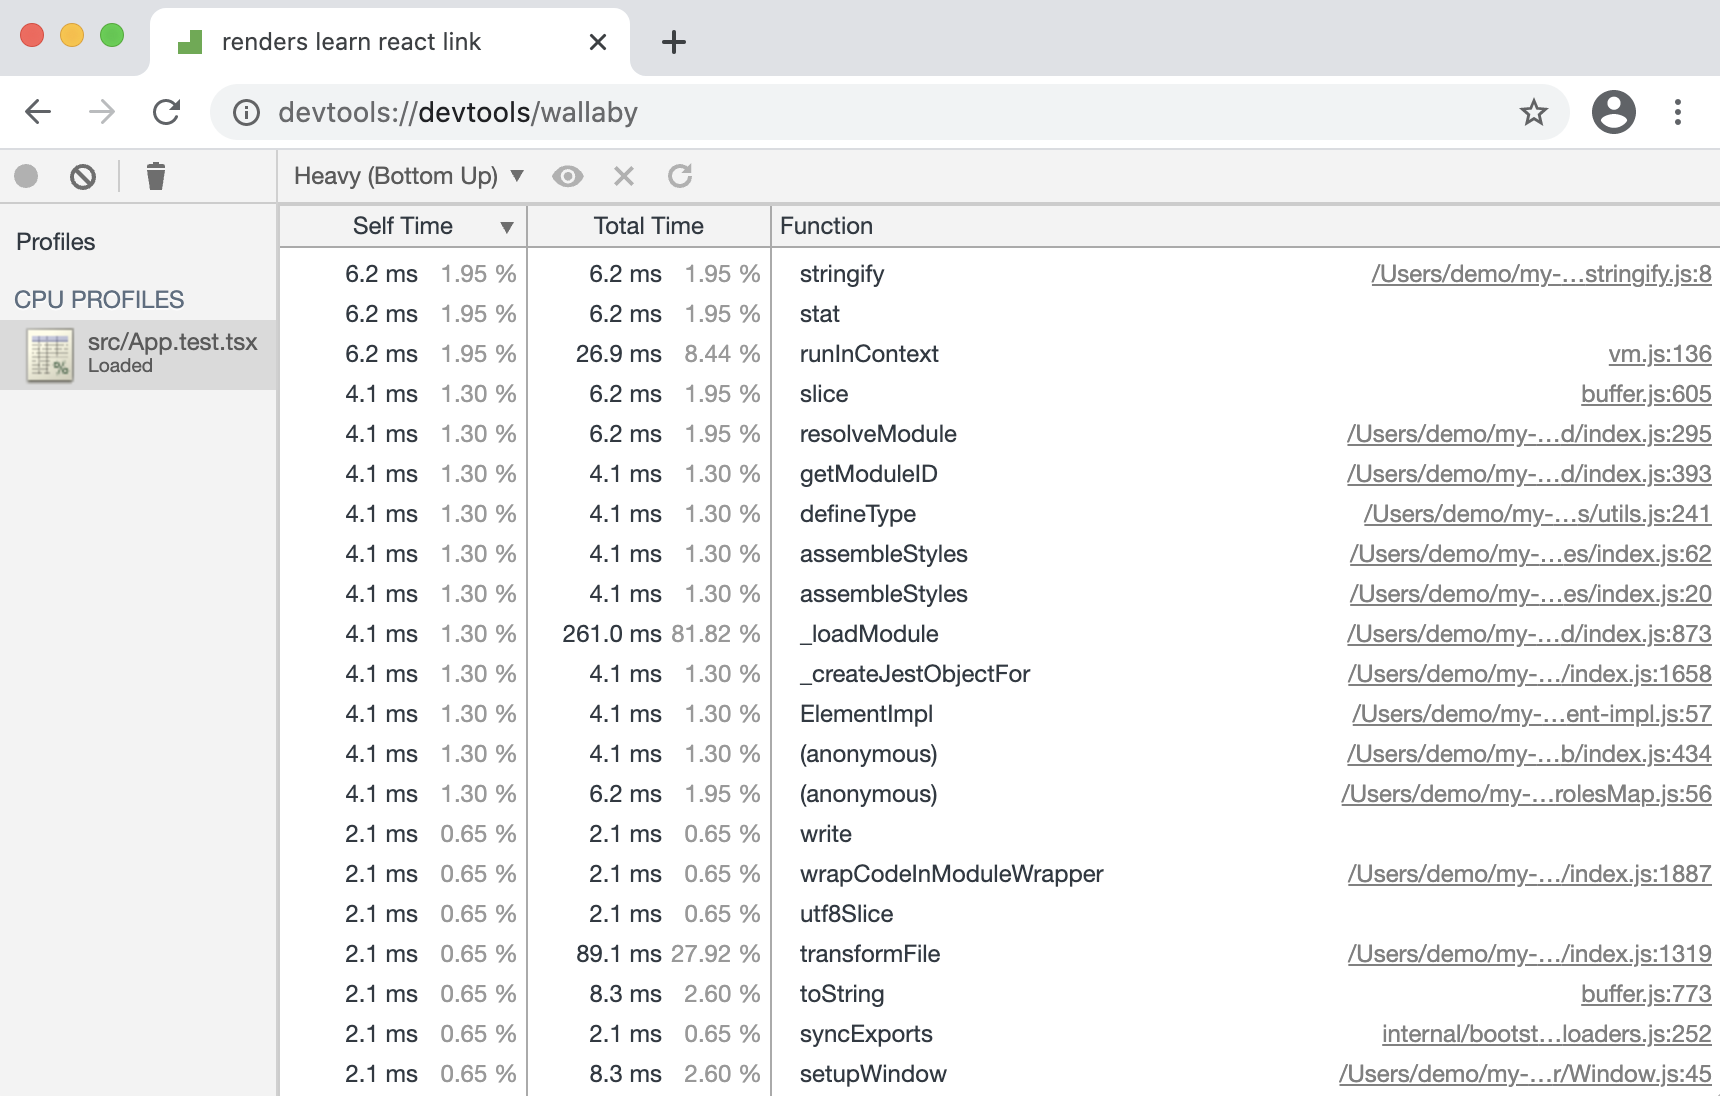
In all the views Self Time represents the time directly spent in that function. Total Time represents the time spent in that function or any of its children. You may click Self Time, Total Time, or Function to sort the table by that column.