Sublime Text
Launching
Wallaby for Sublime Text needs to know what configuration is required to run your tests. If you are using a technology that is supported by
automatic configuration, then you may use the Select for Wallaby.js Automatic Configuration context
menu item for your project folder in the project’s file tree. After that you may use the Wallaby Start command and
Wallaby will remember that you are using automatic configuration. If you have a mono-repo and only want to run for one project,
you may use the Select for Wallaby.js Automatic Configuration context menu item for the project folder.
If your project does not support automatic configuration then Wallaby will automatically search for a configuration file
in your project root and will automatically select it, valid names are: wallaby.js, wallaby.conf.js. If you have multiple
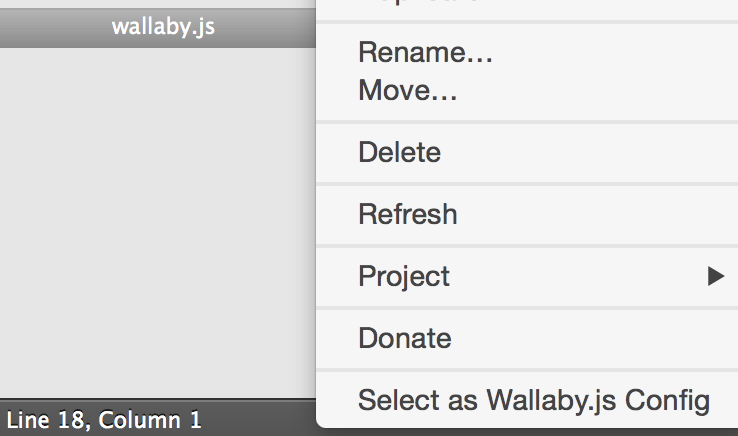
configuration files, use a different naming convention or have the config file outside the root folder, you may select the config file
from your editor Side Bar and use the Select as Wallaby.js Config context menu item.
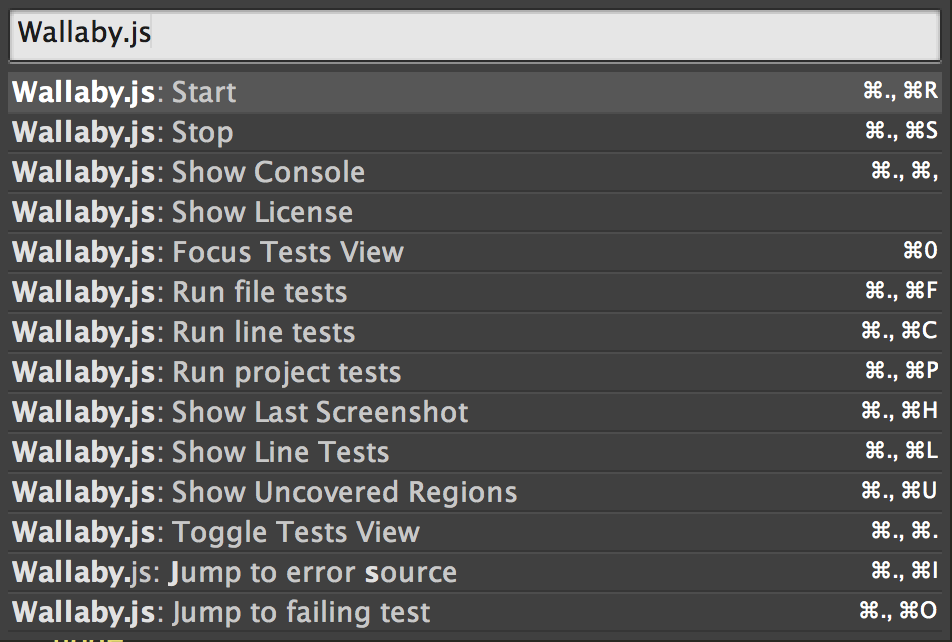
You may press Ctrl/Cmd + Shift + P in Sublime Text to get the editor Command Palette in case if you’ve forgotten some shortcuts or just like invoking commands this way. There you may search for wallaby and use the found commands.
Also, for your convenience Wallaby adds the way to display on Wallaby commands in the Command Palette. You may display just wallaby.js commands by pressing Ctrl/Cmd + Shift + .. It’s a fast and easy way to explore and quickly use various wallaby features.
To stop Wallaby, you may use the Stop command.
Basics
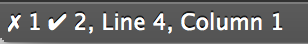
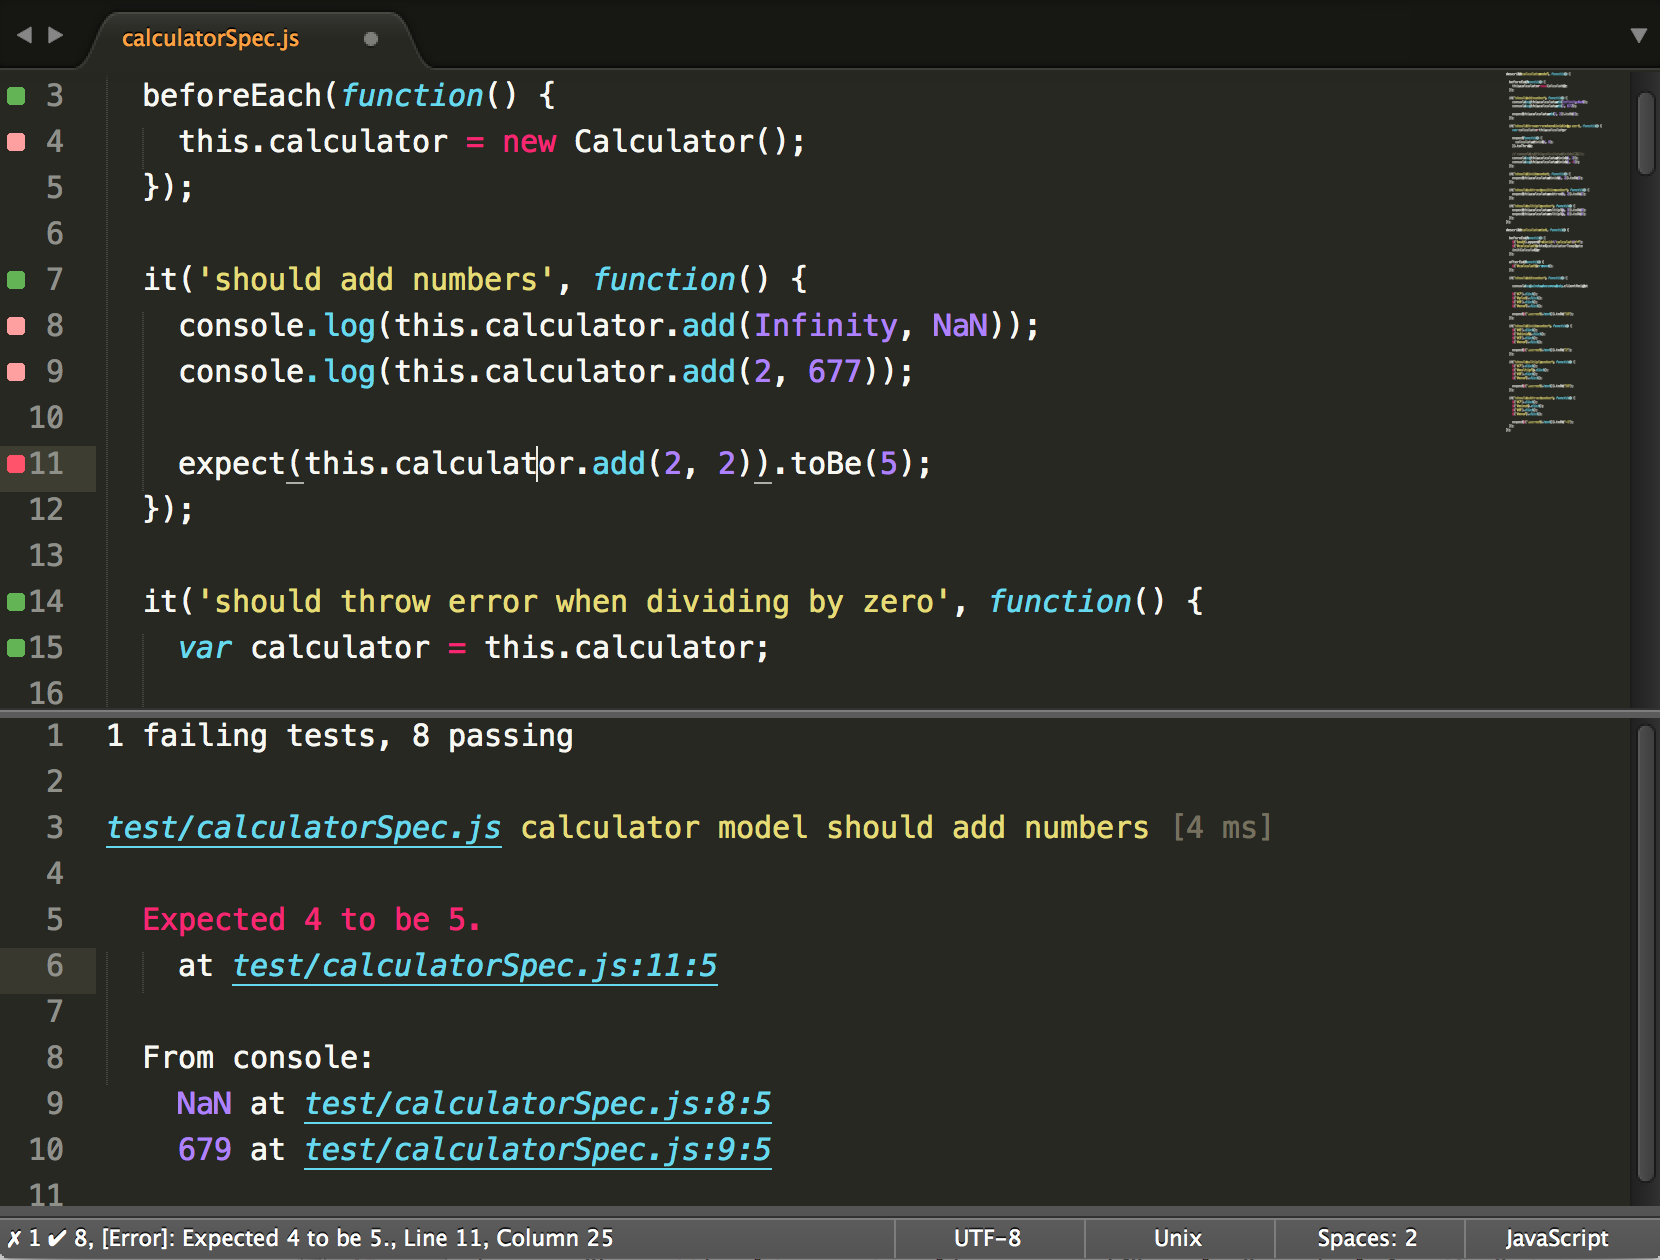
Once you have started wallaby.js, at the bottom left corner of the editor you’ll see wallaby status indicator. It’s job is pretty simple: when it displays a spinner - your tests are running, when it shows a cross - you have some failing tests, when it shows a tick - some of your tests are passing. It also shows the number of failing and passing tests.
When Wallaby is running, you can see the code coverage in opened source files (specified in wallaby configuration file). As you can see, there are various colored squares displayed for each line of your source code.
Try jumping to any of the passing tests and break it, for example try changing the 2 plus 2 expectation result to 5 in the should add numbers test, or try breaking the code covered by the test. Right after the change wallaby.js automatically runs your tests and displays the result inline and in the status bar.
The code coverage and messages are automatically updated, just as you type.
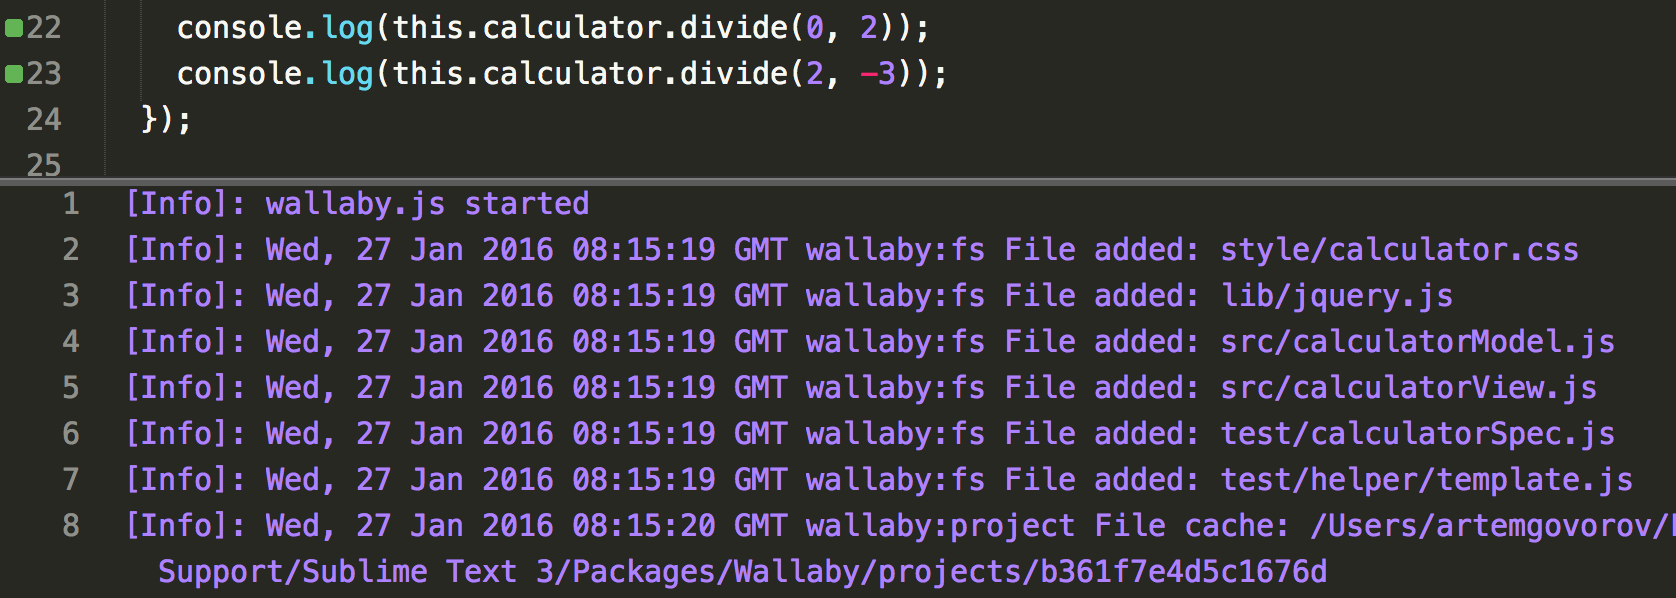
Also, try editing some console.log arguments or just console.log any object you like.
This is a great way to quickly inspect any objects without having to leave your editor, without switching to any other console. Think how cool it is - your code editor is your console with all the required context.
We also recommend reading about some more powerful ways to log things and measure code performance with Wallaby.
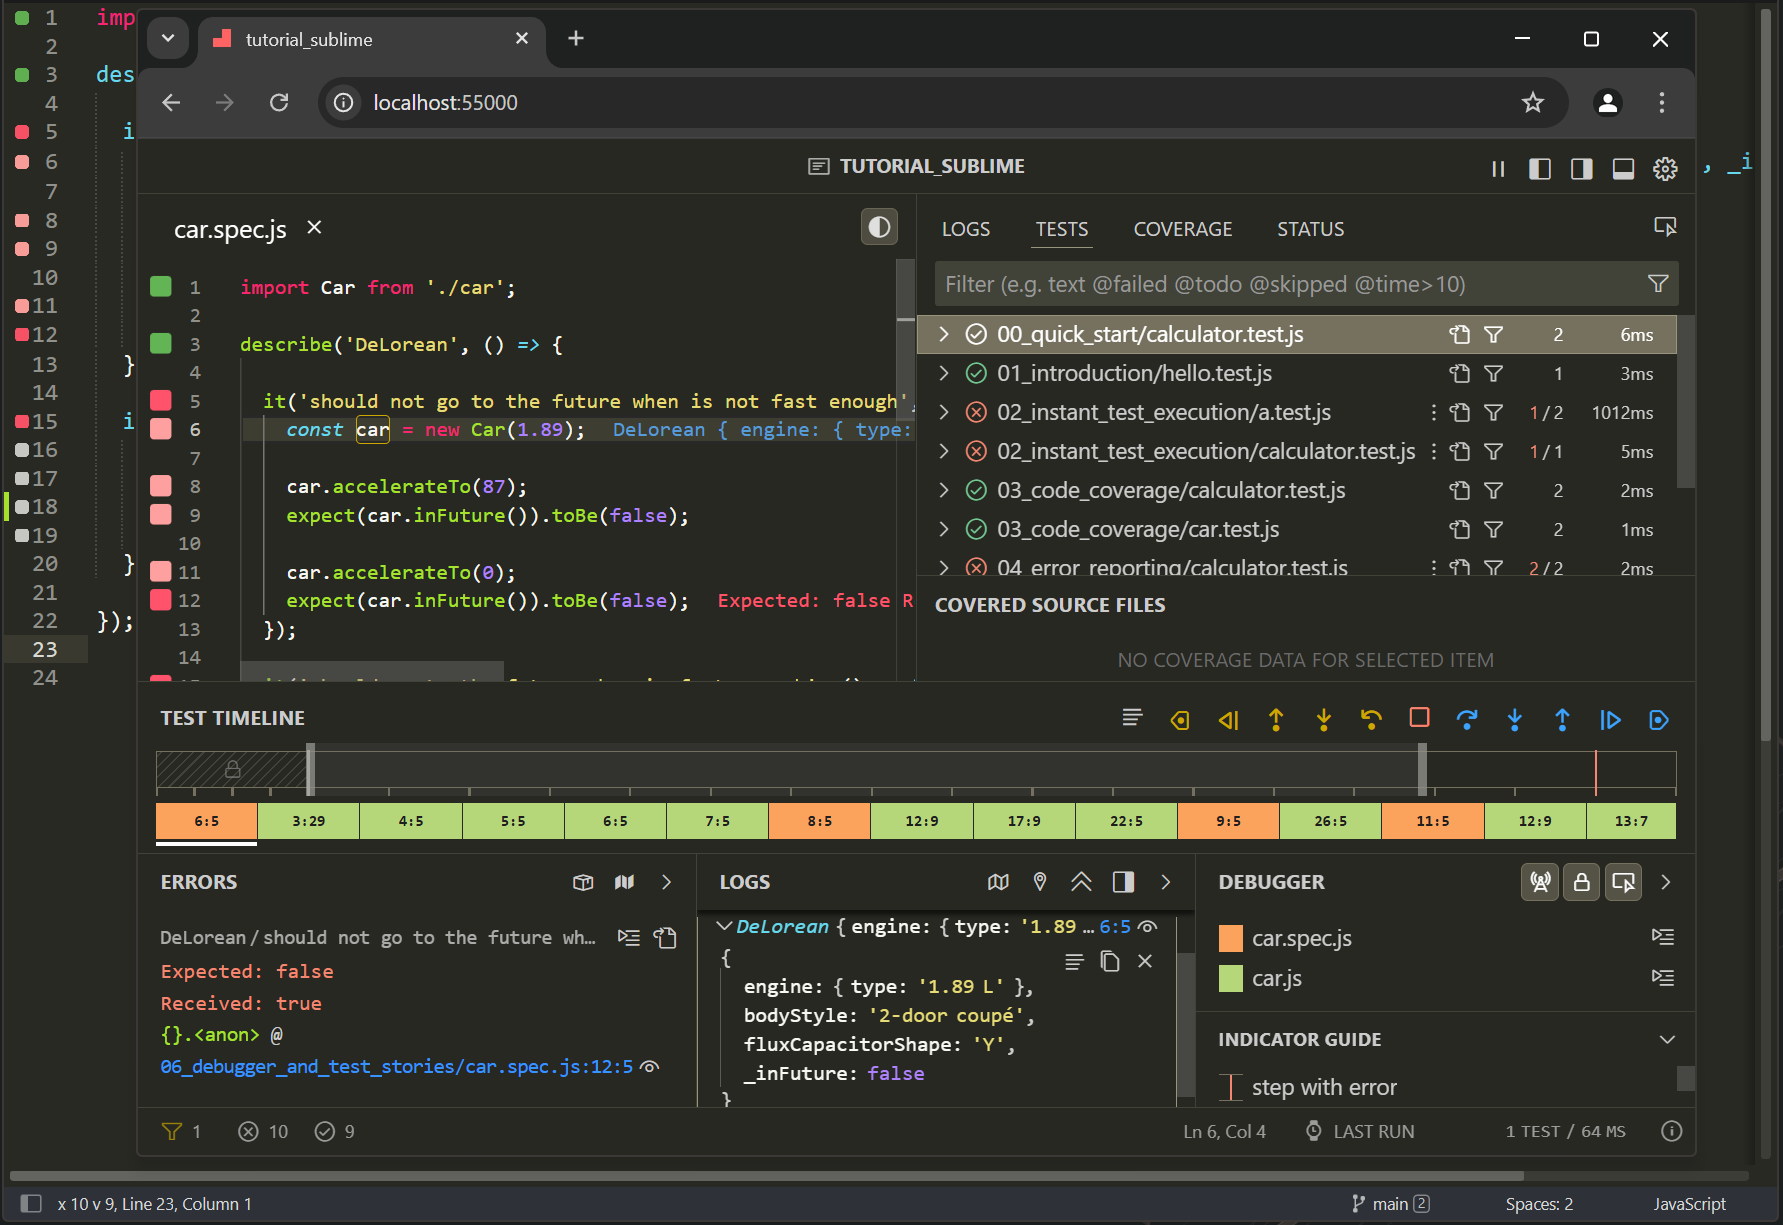
In addition to the native Sublime Text integration, Wallaby provides Linked Mode which can be opened in a separate browser window connected to your editor.
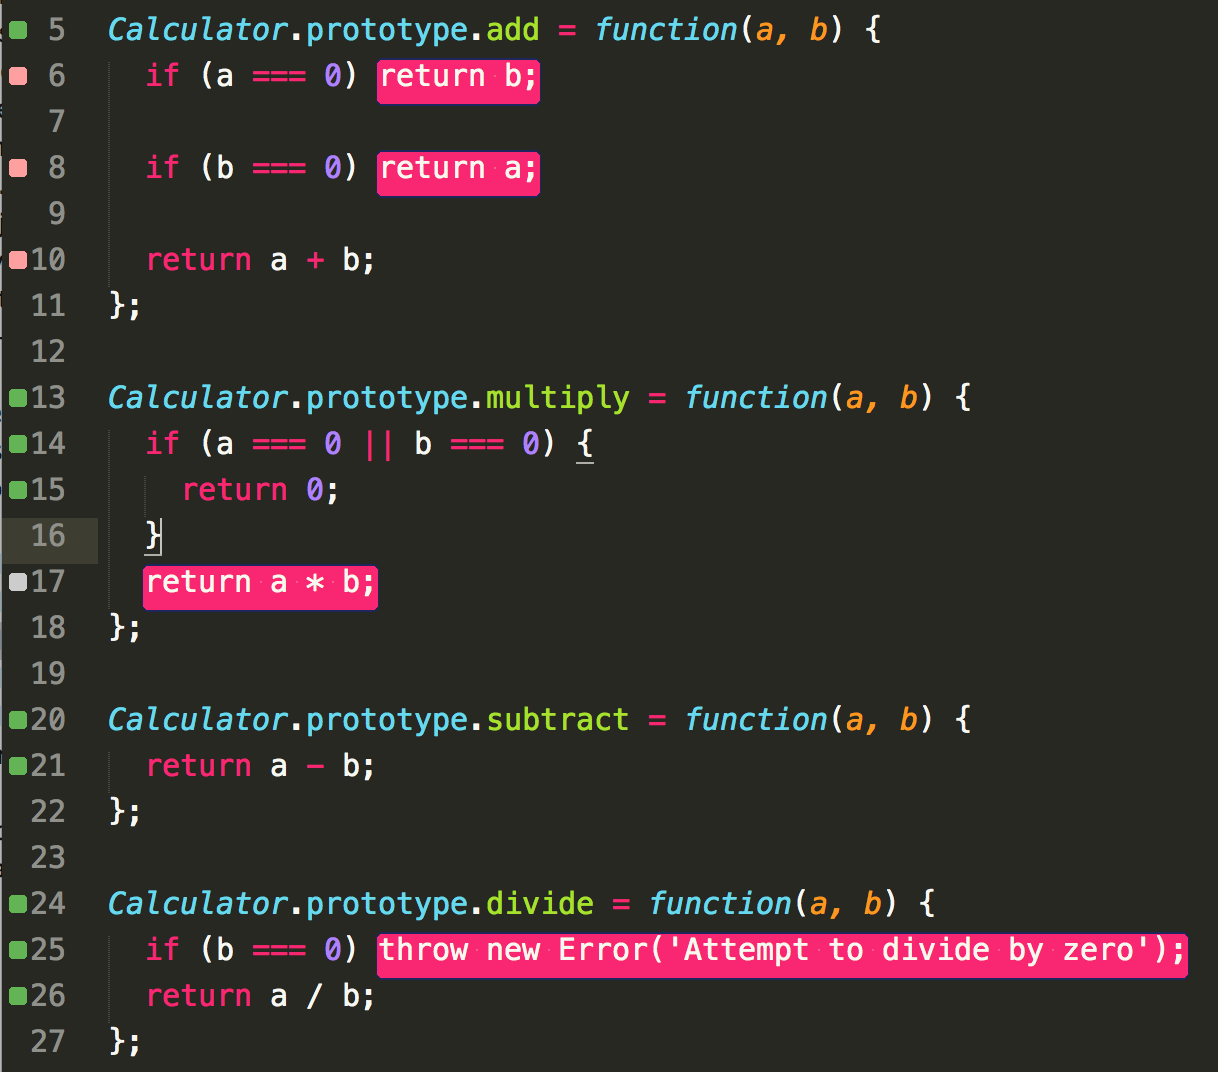
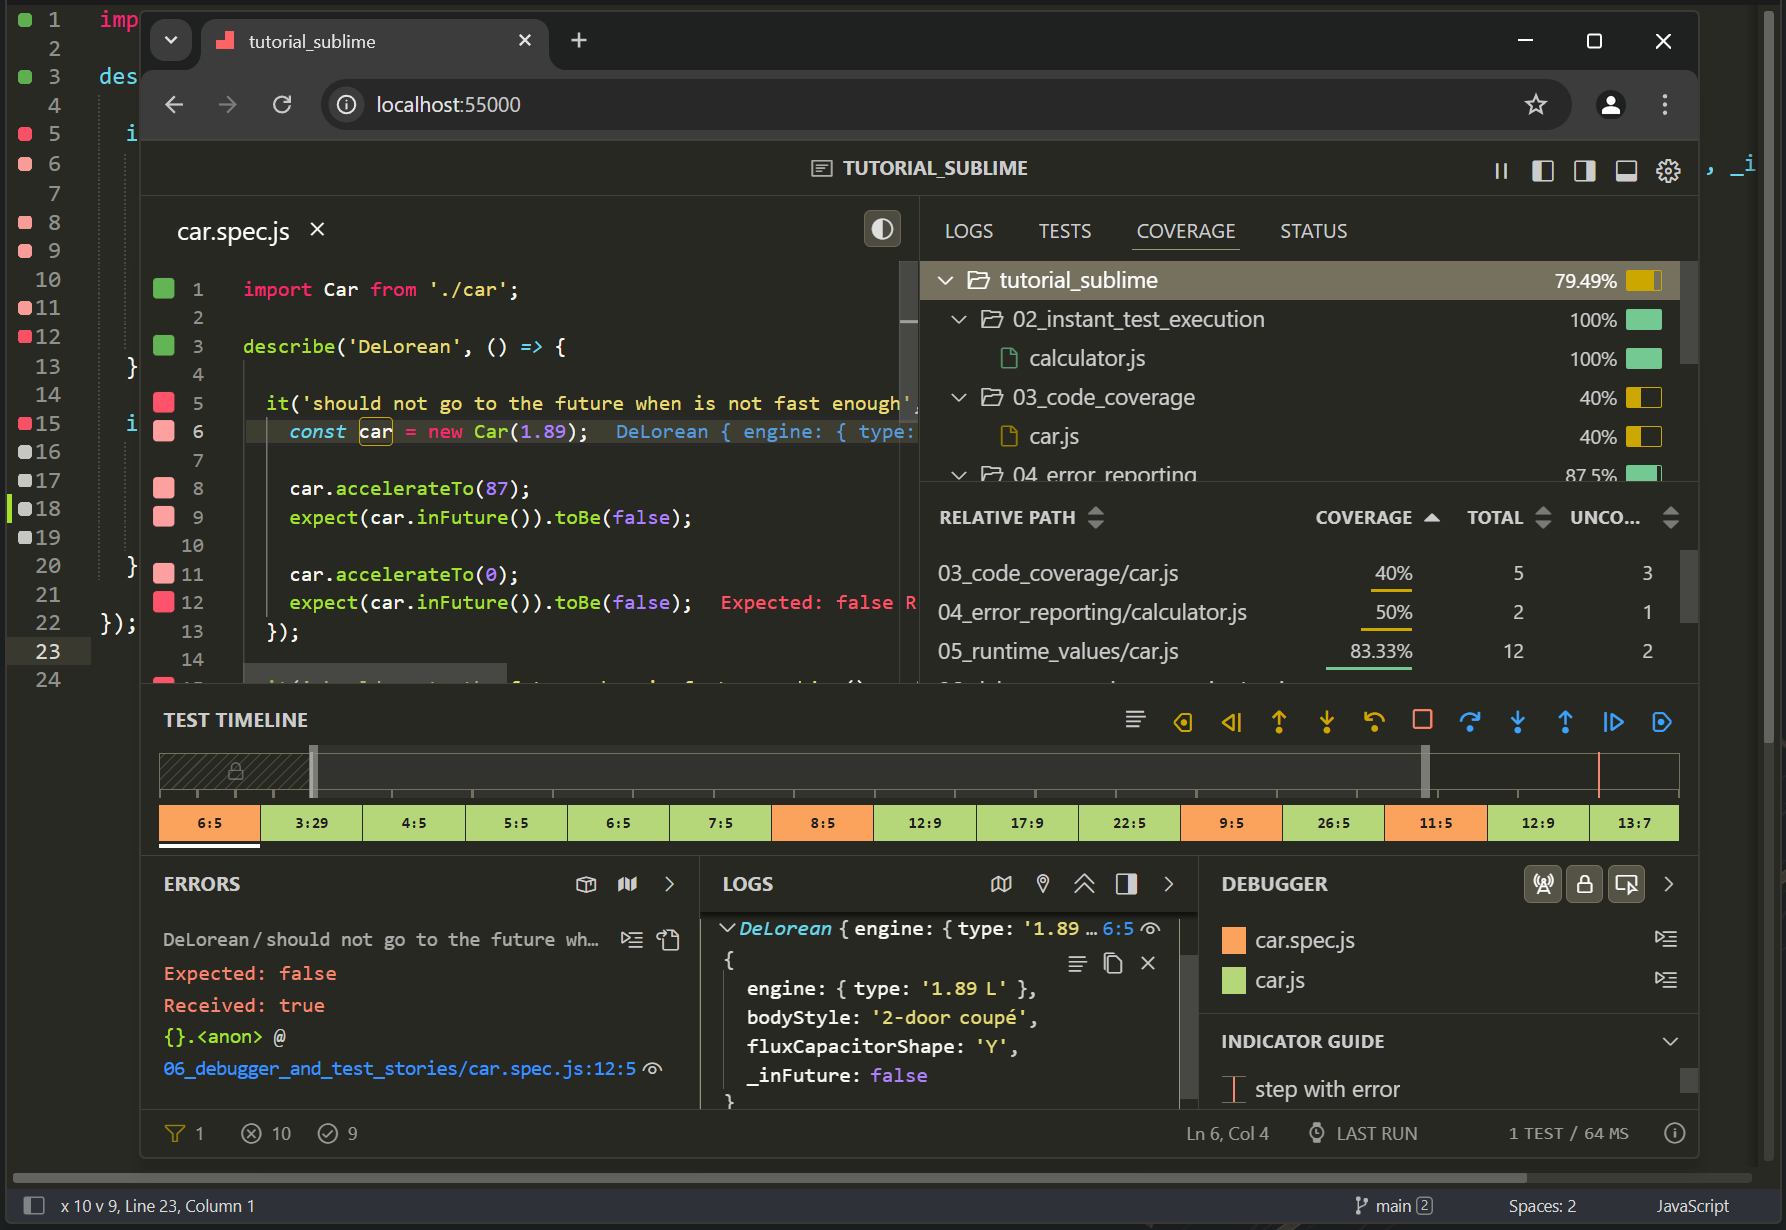
Coverage indicators
Let’s have a look at the editor gutter where you may see some indicators. Here is what these coverage indicators mean:
- Gray squares mean that the source line is not covered by any of your tests.
- Green squares mean that the source line is covered by at least one of your tests.
- Yellow squares mean that the source line is only partially covered by some of your tests.
- Red squares mean that the source line is the source of an error or failed expectation, or is in the stack of an error.
- Pink squares mean that the source line is on the execution path of a failing test.
Inline messages
In addition to the coverage indicators, Wallaby shows and updates inline messages in your editor. These messages include errors and runtime values.
With Wallaby, you don’t need to context switch between the console and your editor to figure out why a test is failing. Inline messages are displayed right next to the code that caused them and gutter indicators help you quickly identify code that is related to a failing test. Often the inline error message will be sufficient to understand what’s going wrong and to fix the error immediately, especially if the top of the error’s stack is on the recently changed line. For example, if we have mistyped a variable name or caused a runtime exception from the line that we have just edited.
Refer to the Advanced Logging section for more information on how to use inline messages for runtime values.
You may turn off inline error and console messages by using the inlineMessages setting in your User/Wallaby.sublime-settings file
{ "inlineMessages": false}Output windows
Wallaby.js Tests View displays all tests that are currently failing along with the error stacks and registered console.log calls. Some bits of the displayed information are hyperlinks so you can navigate (with Enter or Cmd/Ctrl + Shift + double click) to different places, for example to the exact error line, or a line where something is logged to console. To quickly show and focus the panel you may use the Focus Tests View wallaby command (Ctrl/Cmd + 0), or, if you’d like just to show it without focusing, press Ctrl/Cmd + . two times.
Test focusing
Test focusing or Test filtering allows you to limit the display of coverage indicators, console messages, live comment messages and errors messages to only the tests that you are working on instead of all tests in your project.
To add and remove tests from to/from the test filter or clear the test filter you should use the Toggle Test Filter command. The command acts differently depending on whether the editor cursor is:
- on a test declaration line or within a test and the test is not filtered:
test will be added to filtered tests - on a test declaration line or within a test and the test is filtered:
test will be removed from filtered tests - in a test file but outside of any tests:
each test within the file's filter state will be toggled - in a non-test file:
test filter will be reset
In addition to this, Linked Mode supports granular test filter/focus management with full editor synchronization.
Commands
To help you writing/navigating your code and tests more efficiently, wallaby.js provides a few commands. You may see the full list in the wallaby.js Command Palette (Ctrl/Cmd + Shift + .).
These commands include:
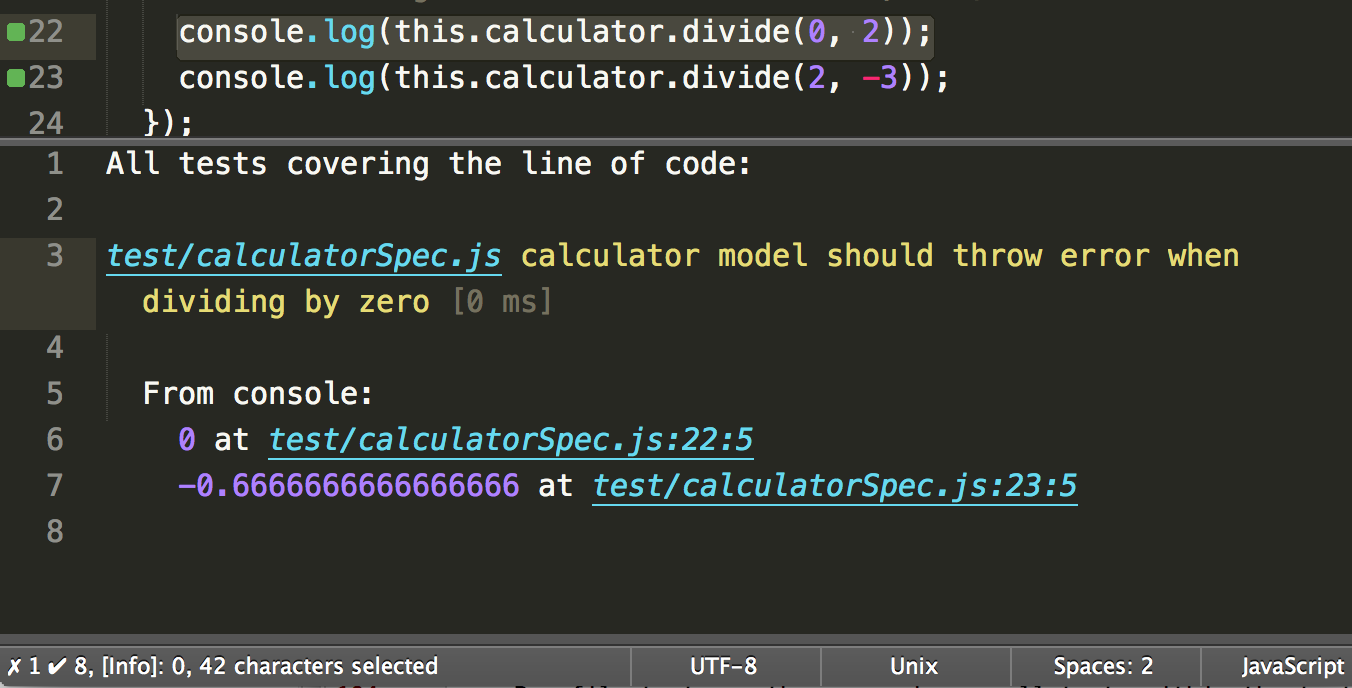
- Show Line Tests: displays the line related test data. The command allows you to quickly view all tests (both failing and passing) that cover the current line of code, navigate to test and code errors, view console messages related to some specific test or some source code line.
- Jump to Failing Test: allows to quickly navigate to the failing test from any ‘pink’ context (the failing test execution path).
- Jump to Error Source: allows to quickly navigate to the source of the test error from any ‘pink’ context (failing test execution path).
- Toggle Uncovered Regions: displays/hides uncovered regions for an opened file. The command is very useful for ‘yellow’ lines to display what is exactly not covered in the line. Highlighted markers will automatically disappear when you start editing your code.
- Run Line Tests: the command is pretty simple, it just runs a single test (if invoked from within the test) or all related tests (if invoked within some source code covered by the tests).
- Run File Tests: the command runs all tests within the test file it is invoked in, or all tests in all the test files that cover the source file that the command is invoked within.
- Run Project Tests: the command runs all tests in your project.
- Toggle Test Filter: adds/removes a test to/from the test filter or clears the test filter. When the test filter is set, the command shows coverage indicators, console messages, live comments messages and errors messages only for the selected tests. When the filter is cleared, the command shows coverage indicators, console messages, live comments messages and errors messages for all tests.
- Make Current Session Run on Any Change: the command makes your current Wallaby session start a test run when code is changed in your editor or when code is saved on disk.
- Make Current Session Run Only on Save: the command makes your current Wallaby session start a test run ONLY when code is saved on disk.
- Toggle Current Session Run Mode (Any Change/On Save): the command toggles between Make Current Session Run on Any Change and Make Current Session Run Only on Save.
Linked Mode
Wallaby Linked Mode allows you to use Wallaby’s new UI in a separate browser window, connected to your editor. It offers a seamless experience with easy navigation between the editor and Wallaby UI.
To open Wallaby Linked Mode, after starting Wallaby, run the Wallaby.js: Open Wallaby in Browser command.
The Linked Mode also includes a code viewer that allows you to choose between viewing code in your editor or directly in the Wallaby UI. This feature provides a convenient way to pick the best view for your current task, ensuring you have the flexibility you need to work efficiently.
Keyboard Shortcuts
Wallaby provides quick access to keyboard shortcuts documentation in both the Overview and Side view panels. Simply press the ? key while focused on either panel to display a comprehensive list of available shortcuts. This feature helps you navigate and interact with Wallaby’s interface more efficiently, making it easier to access various functionalities without reaching for the mouse. The shortcuts help overlay remains visible until you press Escape to dismiss it, allowing you to learn and reference the shortcuts at your own pace.
Troubleshooting
If you encounter any issues with configuring or using wallaby.js and are not sure why it happens, check out our troubleshooting docs section or search our public repository issues to see if someone else has experienced something similar.
Another very useful technique is to run wallaby.js with the trace flag set to true. In this case wallaby outputs a lot of additional information about the test execution progress which may help you to understand what’s going on if something goes wrong. The output can be viewed in the Wallaby.js Console (Wallaby.js: Show Console command or Ctrl/Cmd + ., Ctrl/Cmd + , shortcut).