Visual Studio
Launching
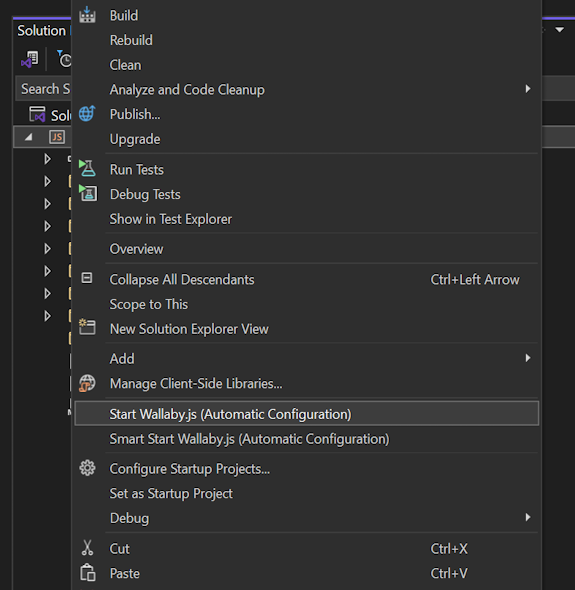
Wallaby for Visual Studio needs to know what configuration is required to run your tests. If you are using a technology that is supported by
automatic configuration, then you may use the Start Wallaby.js (Automatic Configuration) context menu
item for your project folder in the Solution Explorer. After the first start, the selected project will be remembered for your
solution and Wallaby can be started with Tools->Start Wallaby.js (Alt-W, 1).
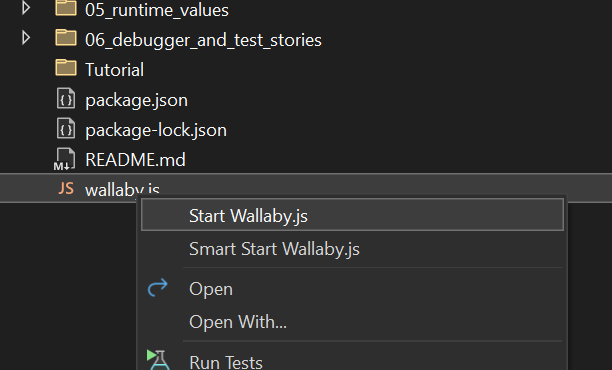
If your project does not support automatic configuration then you must first create a configuration file. After creating a configuration file
you may start Wallaby by right clicking on the configuration file in the Solution Explorer and then selecting Start Wallaby.js from the
context menu. After the first start, the selected configuration file will be remembered for your solution and Wallaby can be started
with Tools->Start Wallaby.js (Alt-W, 1).
If you have your tests and source code in different projects, then the recommended approach is to make your Wallaby configuration file one of your Solution Items.
To stop Wallaby, you may use the Stop Wallaby.js context menu item.
The very first time Wallaby starts, it may take a minute or two to install its dependencies. After this initial start, dependencies are updated in the background automatically when required.
Basics
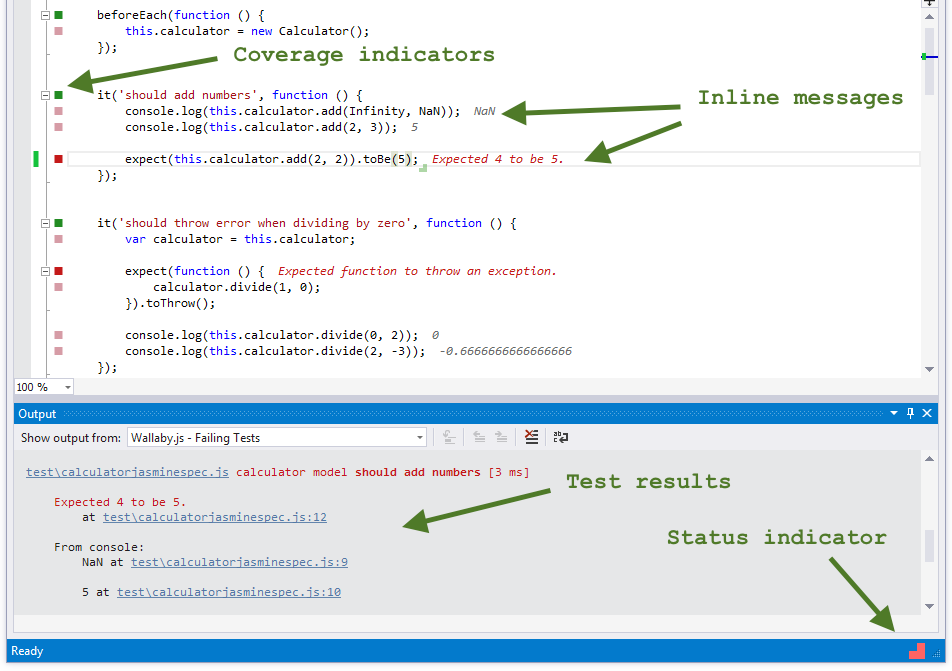
Once Wallaby is started, in the bottom right-hand corner of the screen you’ll see the status indicator. Its job is pretty simple: when it displays a spinner, your tests are running; when red, you have some failing tests; when green, all of your tests are passing.
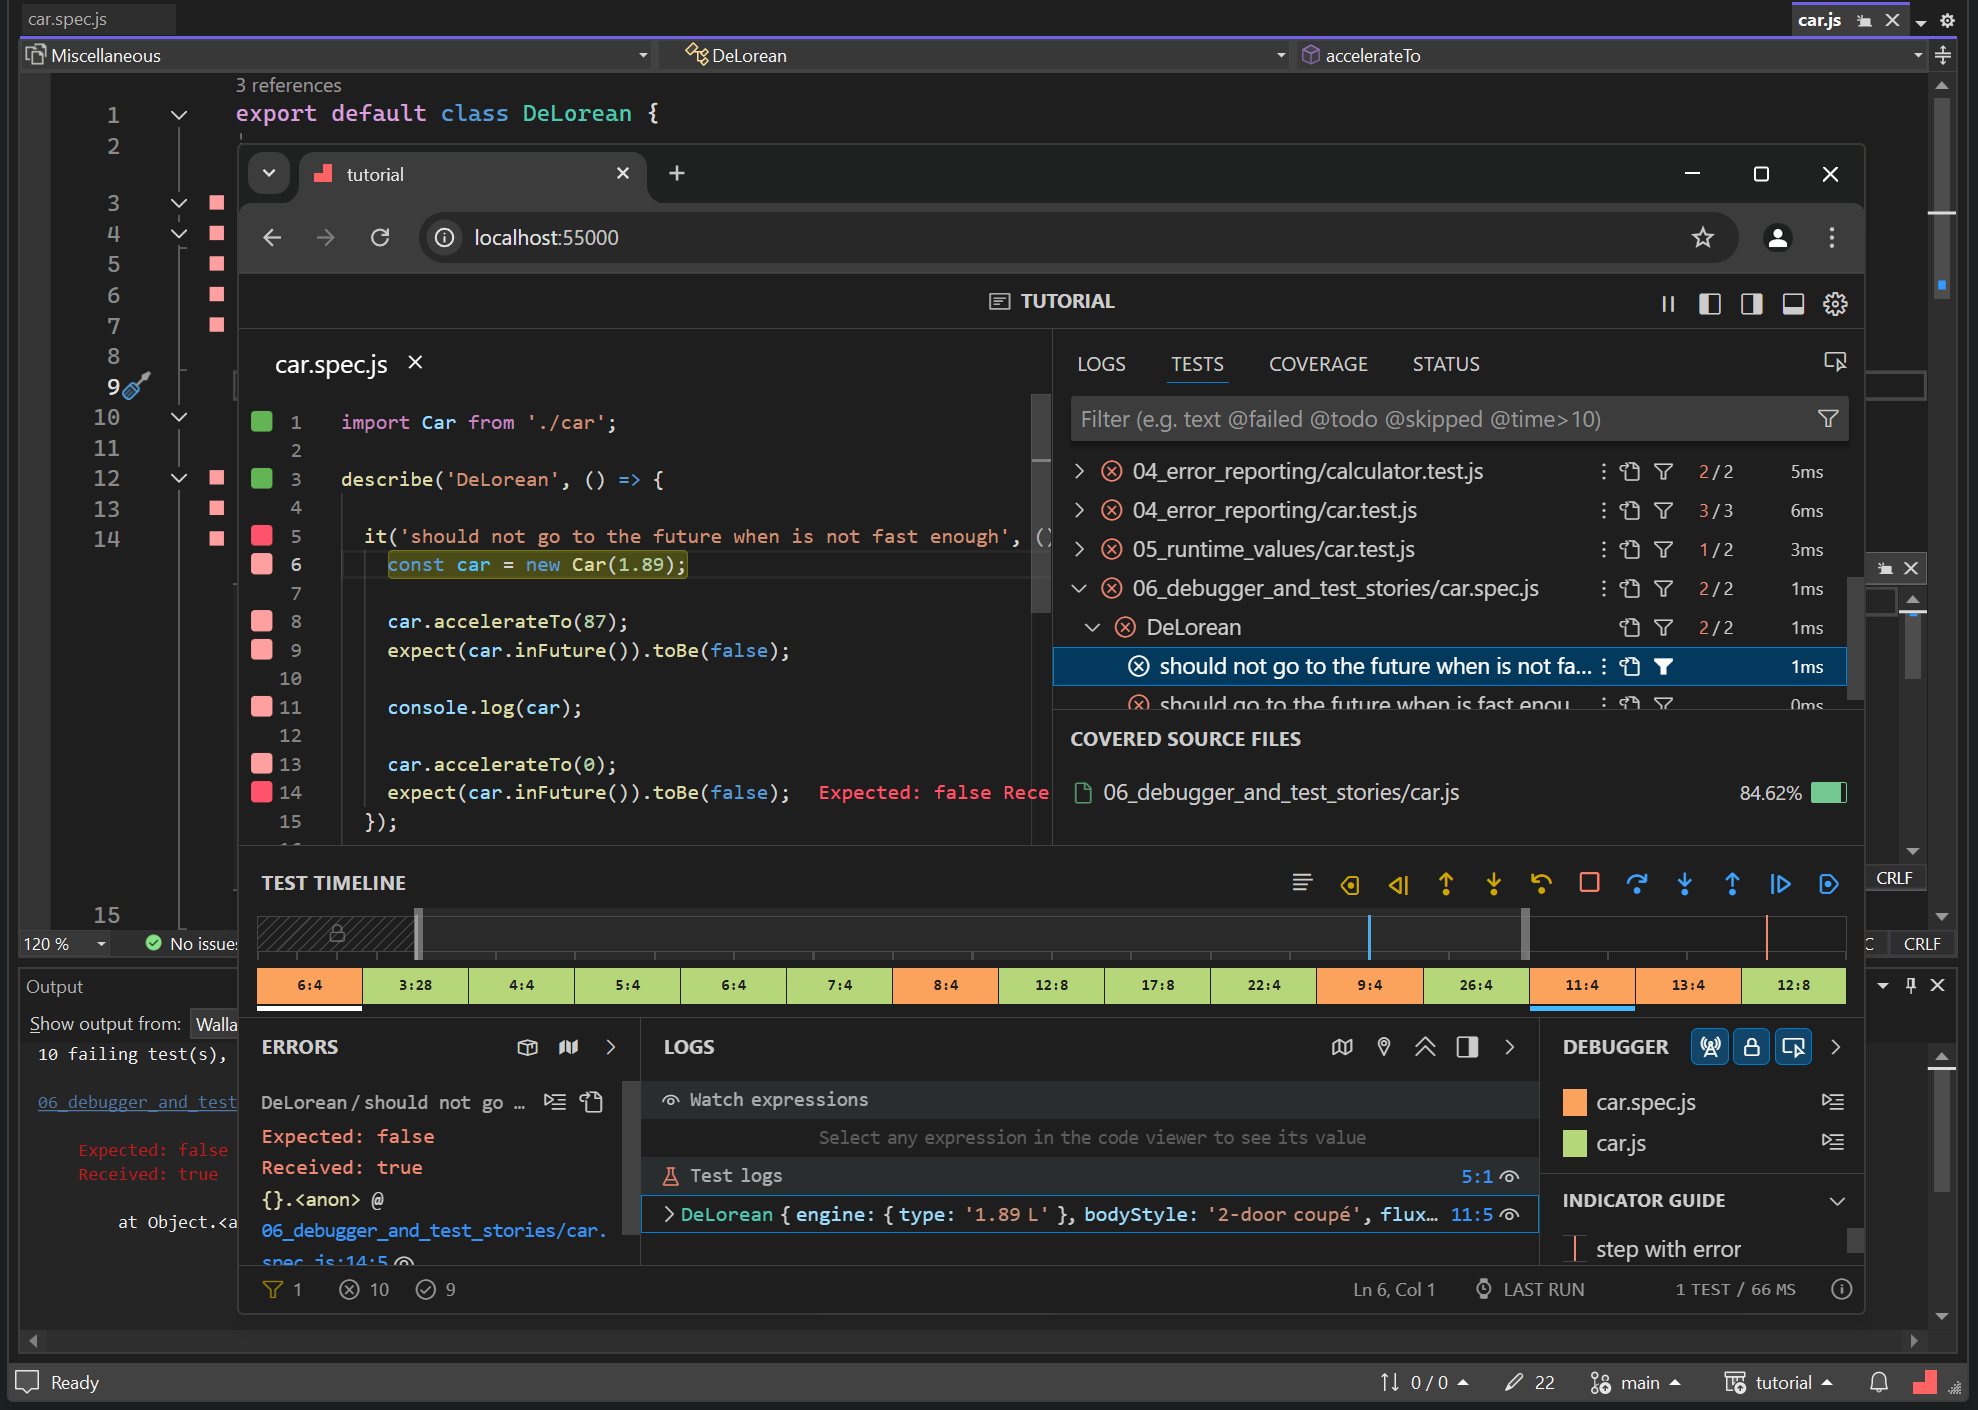
In addition to the native Visual Studio integration, Wallaby provides Linked Mode which can be opened in a separate browser window connected to your editor.
Coverage indicators
When Wallaby is running, you can see the code coverage in the source files that it tracks. As you can see, there are various colored squares displayed for each line of your source code.
The code coverage are automatically updated, right as you type.
Here is what coverage indicators mean:
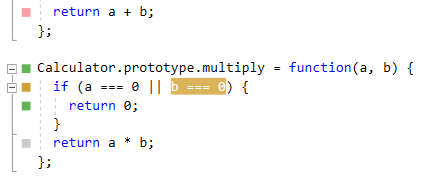
- Gray squares mean that the source line is not covered by any of your tests.
- Green squares mean that the source line is covered by at least one of your tests.
- Yellow squares mean that the source line is only partially covered by some of your tests.
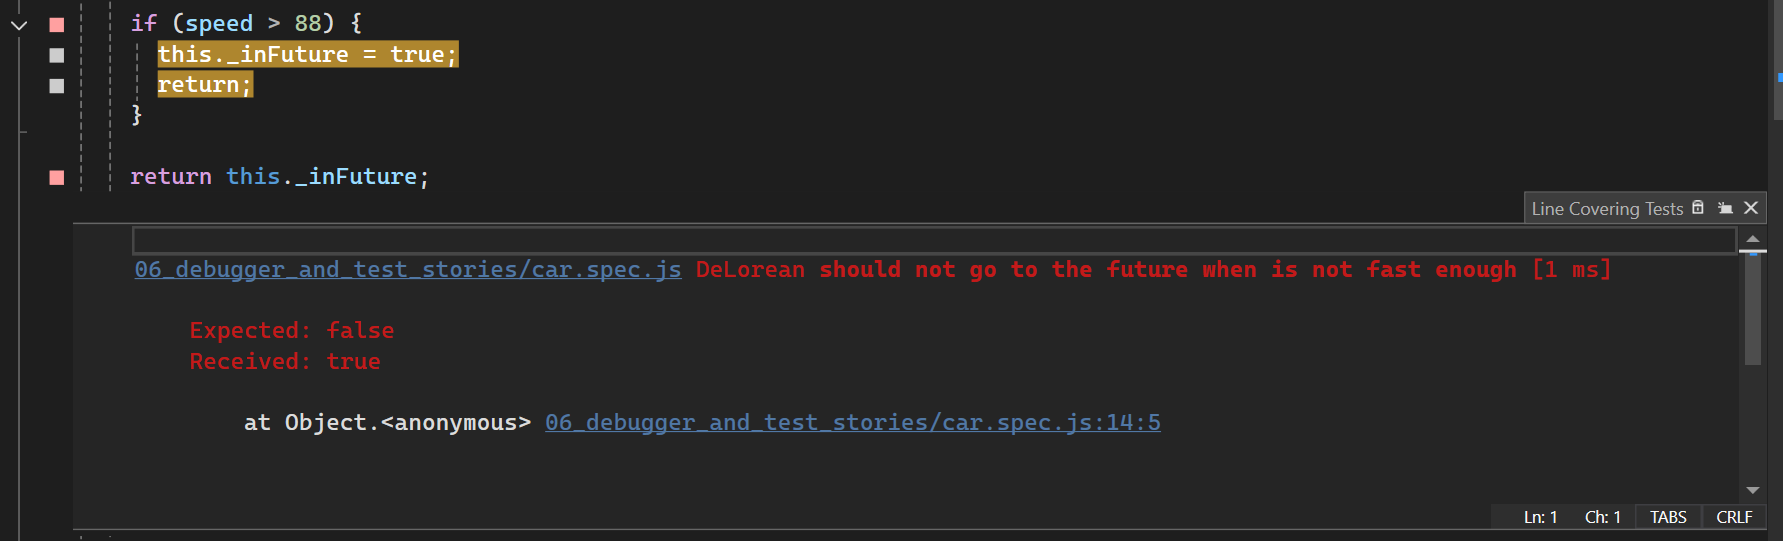
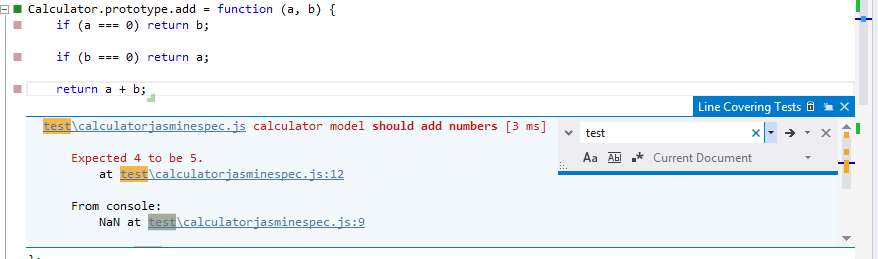
- Red squares mean that the source line is the source of an error or failed expectation, or is in the stack of an error.
- Pink squares mean that the source line is on the execution path of a failing test.
Depending on the context, the coverage indicators can be interactive. For example, when you click on a yellow marker, you will see uncovered regions for the line. When you click on a red/pink marker, you will see the line tests displayed in a peek view.
Inline messages
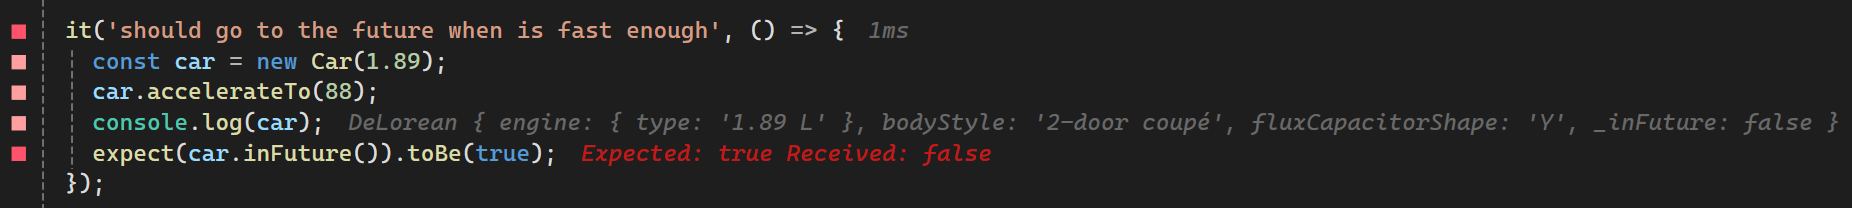
In addition to the coverage indicators, Wallaby shows and updates inline messages in your editor. These messages include errors and runtime values.
With Wallaby, you don’t need to context switch between the console and your editor to figure out why a test is failing. Inline messages are displayed right next to the code that caused them and gutter indicators help you quickly identify code that is related to a failing test. Often the inline error message will be sufficient to understand what’s going wrong and to fix the error immediately, especially if the top of the error’s stack is on the recently changed line. For example, if we have mistyped a variable name or caused a runtime exception from the line that we have just edited.
Refer to the Advanced Logging section for more information on how to use inline messages for runtime values.
Output tool windows
You may also inspect Wallaby output in the Output tool window. In the tool window you may view output from the Failing Tests tab and Console.
The Failing Tests output source displays all tests that are currently failing along with the error stacks and registered console.log calls. Some bits of the displayed information are hyperlinks that you can use with your mouse (Ctrl + mouse click) or keyboard (F12) to navigate to different places, for example: to the exact error line, a failing test or a place where something is logged to console.
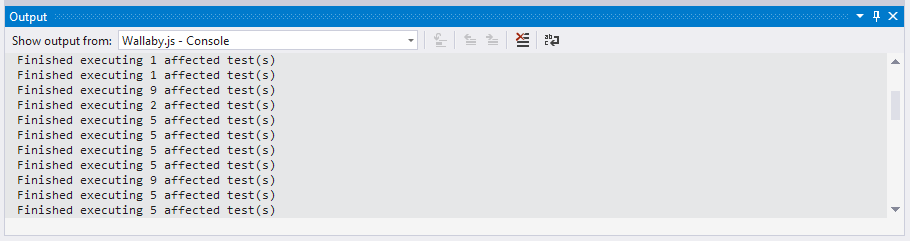
The Console output source displays some additional information about test execution progress. The tab can also be useful for troubleshooting Wallaby issues.
Test focusing
Test focusing or Test filtering allows you to limit the display of coverage indicators, console messages, live comment messages and errors messages to only the tests that you are working on instead of all tests in your project.
To add and remove tests from to/from the test filter you should use the Toggle test filter quick action which is available when editor cursor is on a test declaration line.
You may reset the test filter by clicking on the Reset Test Filter menu item.
In addition to this, Linked Mode supports granular test filter/focus management with full editor synchronization.
Quick actions
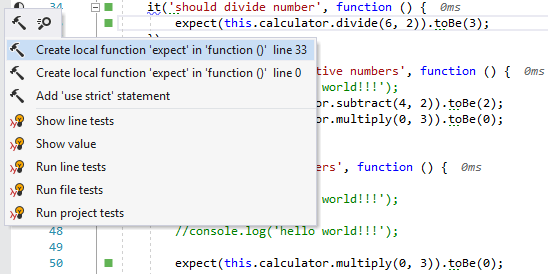
To help you write your code and tests more efficiently, Wallaby provides a number of quick actions, which are available by clicking the light bulb gutter icon or pressing Ctrl + .. Quick actions only display when they are relevant, based on your line context.
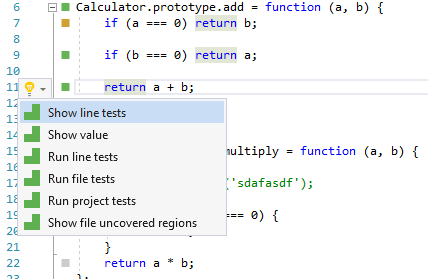
The actions include:
- Show line test: displays the line-related test data. This is the most frequently used action that allows you to quickly view and navigate to test/code errors and console messages. The
Show line testwindow can be closed by pressingEsc.
- Show value: quickly display an expression value without modifying your code.
- Jump to failing test: quickly navigate to the failing test from the failing test execution path.
- Jump to error source: quickly navigate to the source of the test error from the failing test execution path.
- Show line uncovered regions: this action is useful for lines with the “yellow” marker to display what exactly is not covered in the line. By default, uncovered expressions will be highlighted in orange.
- Show file uncovered regions: similar to the previous action, this displays uncovered regions for the whole file. The orange highlights for both actions can be removed by pressing Esc (or you can just start changing the file code and they will disappear).
- Show assertion data diff: displays the difference between the actual and expected data of the failed assertion (normally an equality one).
- Run line tests: the action is pretty simple (yet so wanted by so many) – it just runs a single test (if invoked from within the test) or all related tests (if invoked within some source code covered by the tests).
- Run file tests: the action runs all tests within the test file it is invoked in, or all tests in all the test files that cover the source file that the action is invoked within.
- Run project tests: the action runs all tests in your project.
- Update project snapshots: the action updates all Jest snapshots in your project.
- Update file snapshots: the action updates all Jest snapshots in the current (focused) file, or all snapshots in all the test files that cover the source file that the action is invoked within.
- Update test snapshots: the action updates snapshots of a single test (if invoked from within the test) or all snapshots in all related tests (if invoked within some source code covered by the tests).
- Toggle test filter: adds/removes a test to/from the test filter. When the test filter is set, the action shows coverage indicators, console messages, live comments messages and errors messages only for the selected tests. When the filter is cleared, the action shows coverage indicators, console messages, live comments messages and errors messages for all tests.
All of the described actions can also be mapped to any keyboard shortcuts you prefer for extra productivity. You can do so in Tools - Options - Environment - Keyboard (search for wallaby in the keymap settings).
Commands
Some actions are also available from other contexts as described below. As with the quick actions above, these actions may be mapped to keyboard shortcuts for extra productivity using Tools - Options - Environment - Keyboard.
-
Tools Menu
- Start Wallaby.js: Starts Wallaby using the configuration file/option that was last selected for the opened solution.
- Stop Wallaby.js: Stops Wallaby; is only available when Wallaby is running.
- Run Project Tests: Runs all tests for the current project; is only available when Wallaby is running. Note: if snapshots exist for the project, they will be updated for all tests.
- Jump to Failing Test: quickly navigate to the failing test from the failing test execution path; is only available when Wallaby is running.
- Jump to Error Source: quickly navigate to the source of the test error from the failing test execution path; is only available when Wallaby is running.
- Reset Test Filter: clears the Test Filter; is only available when Wallaby is running and the Test Filter is set.
- Make Current Session Run Only on Save: the command makes your current Wallaby session start a test run ONLY when code is saved on disk; is only available when Wallaby is running.
- Make Current Session Run on Any Change: makes your current Wallaby session start a test run whenever code is changed in your editor or when code is saved on disk; is only available when Wallaby is running.
- Toggle Current Session Run Mode (Any Change/On Save): the command toggles between Make Current Session Run Only on Save and Make Current Session Run on Any Change; is only available when Wallaby is running.
-
Help Menu
- Wallaby.js
- Manage License: Displays your Wallaby.js license (if one has been provided) and also allows you to replace and activate a Wallaby.js license.
- Copy Diagnostics Report: Copies the Wallaby.js diagnostic report to your clipboard; is only available when Wallaby is running.
- Wallaby.js
-
Solution Explorer
- Start Wallaby.js: Starts Wallaby; available on Solution, Project, Folder, and File nodes. If you start Wallaby on your Solution node then the first project in the solution will be started using Wallaby’s automatic configuration feature. If you start Wallaby on a Project node or Folder then Wallaby will be started on the folder using Wallaby’s automatic configuration feature. If a file is selected then the file must be a valid Wallaby.js configuration file.
Linked Mode
Wallaby Linked Mode allows you to use Wallaby’s new UI in a separate browser window, connected to your editor. It offers a seamless experience with easy navigation between the editor and Wallaby UI.
To open Linked Mode, after starting Wallaby, click a Wallaby Linked Mode is available at http://localhost:55000-like link in Wallaby.js: Console output tool window.
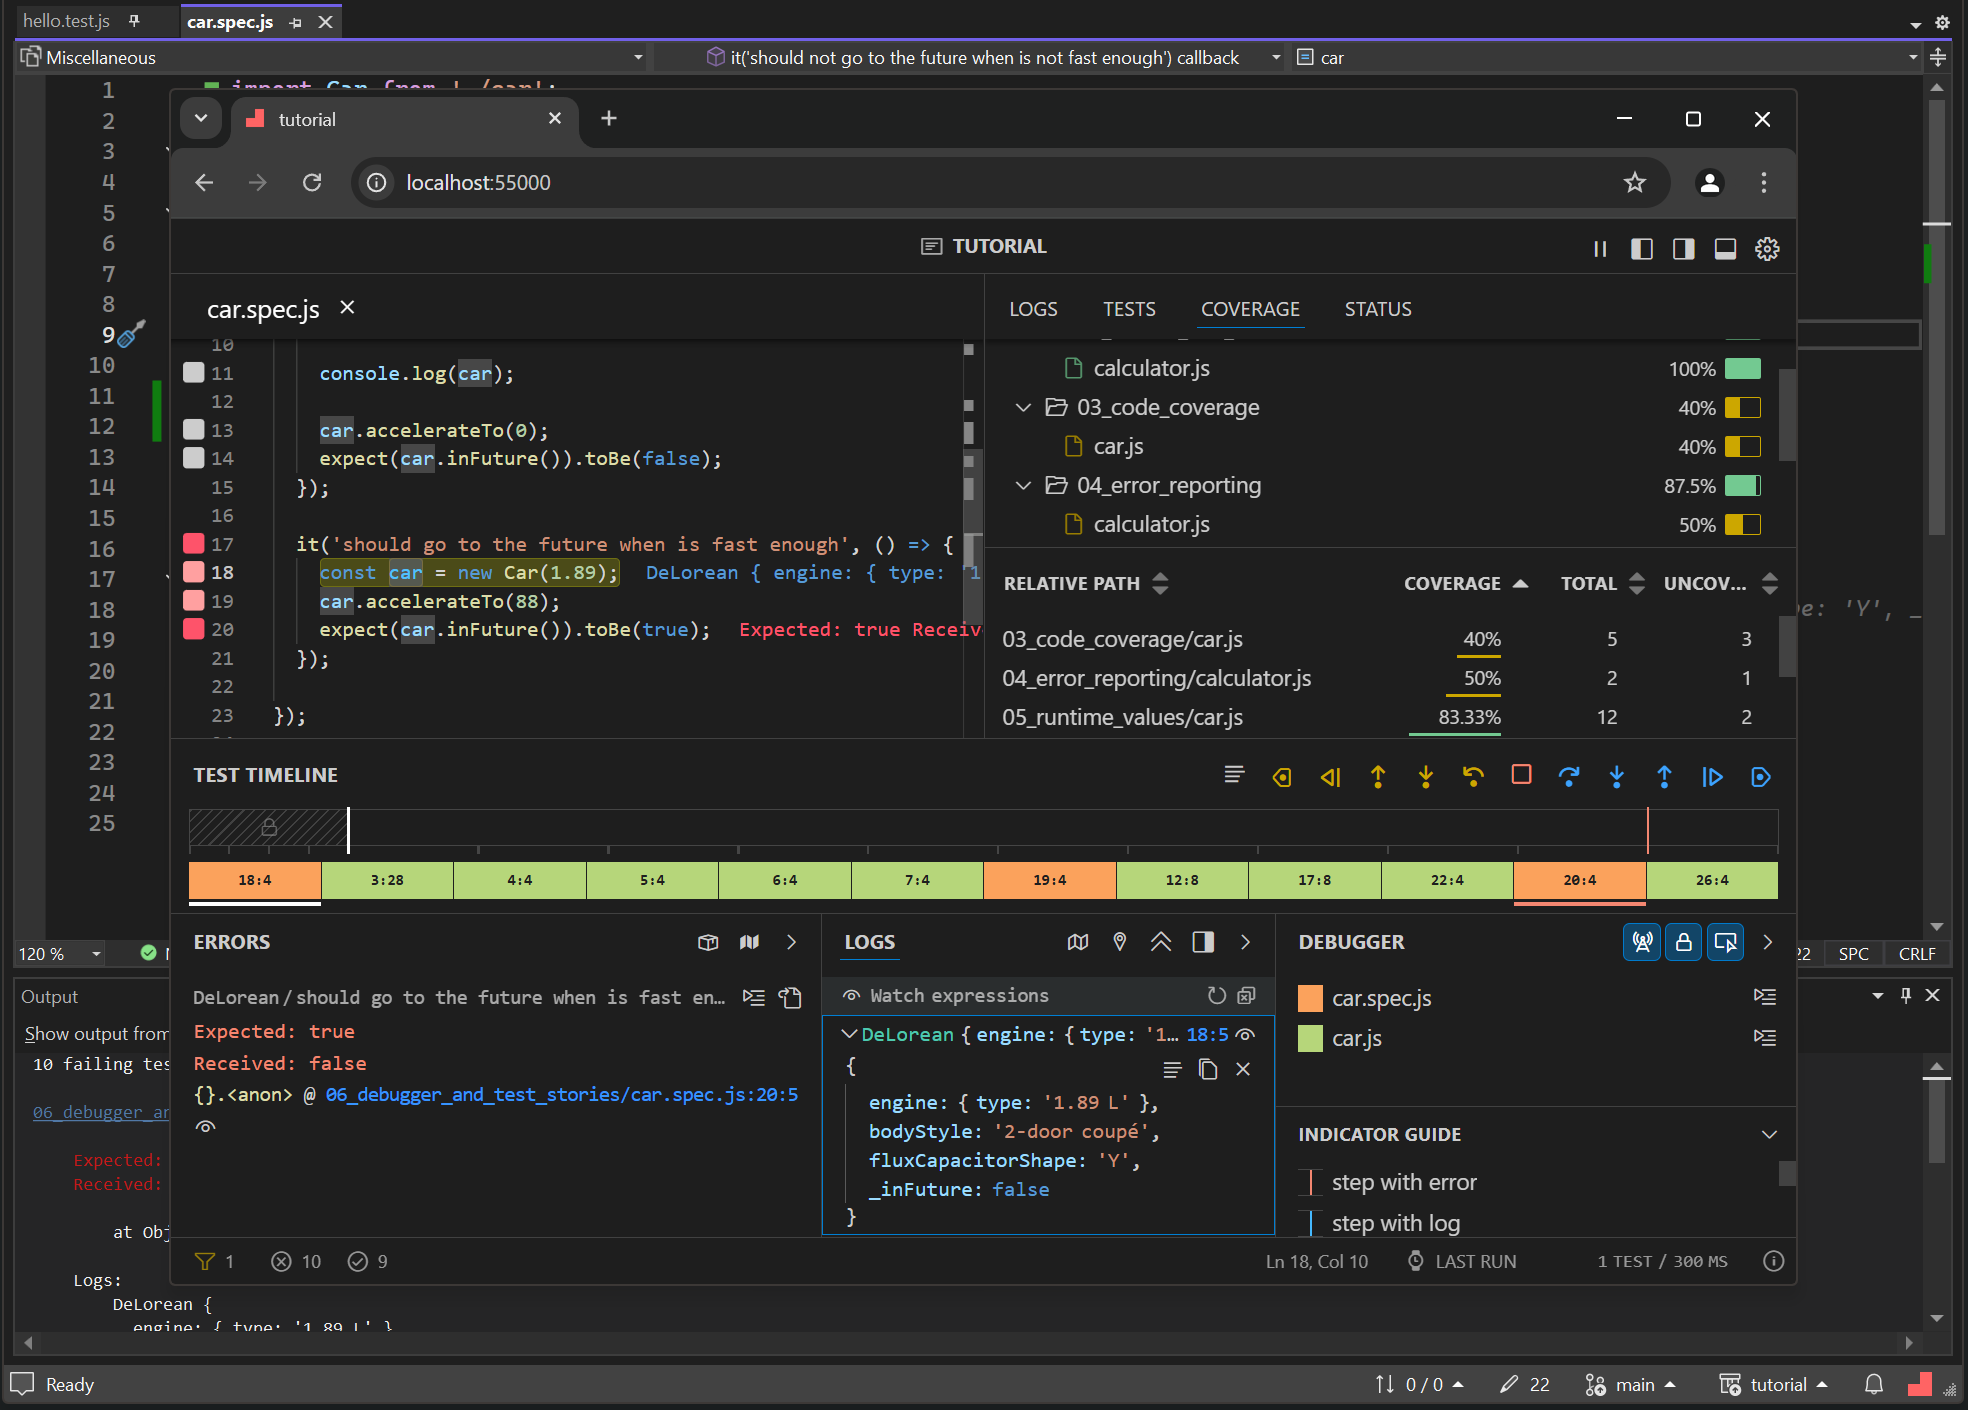
The Linked Mode also includes a code viewer that allows you to choose between viewing code in your editor or directly in Wallaby UI. This feature provides a convenient way to pick the best view for your current task, ensuring you have the flexibility you need to work efficiently.
Keyboard Shortcuts
Wallaby provides quick access to keyboard shortcuts documentation in both the Overview and Side view panels. Simply press the ? key while focused on either panel to display a comprehensive list of available shortcuts. This feature helps you navigate and interact with Wallaby’s interface more efficiently, making it easier to access various functionalities without reaching for the mouse. The shortcuts help overlay remains visible until you press Escape to dismiss it, allowing you to learn and reference the shortcuts at your own pace.
Settings
Fonts and colors
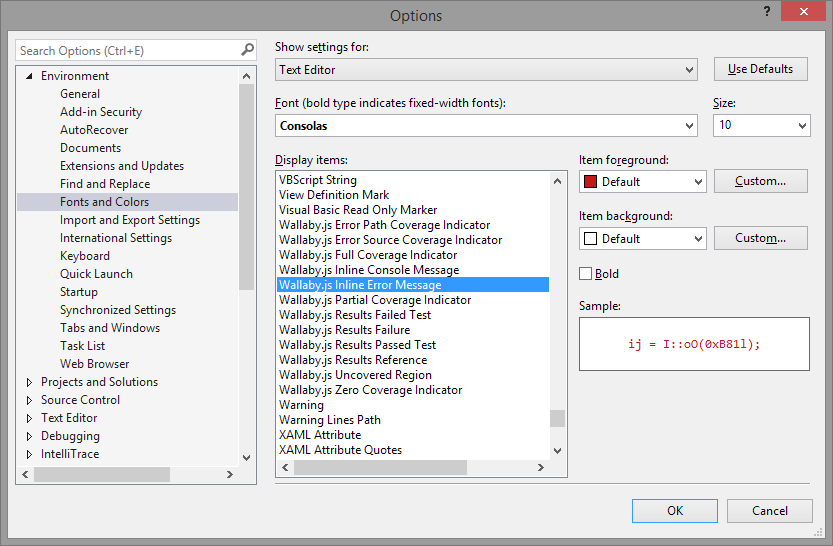
If some Wallaby default colors don’t fit your theme, they are very easy to adjust.
ReSharper compatibility
If you have ReSharper installed, you need to check that the Do not show Visual Studio Light Bulb setting is disabled to be able to use Wallaby quick actions:
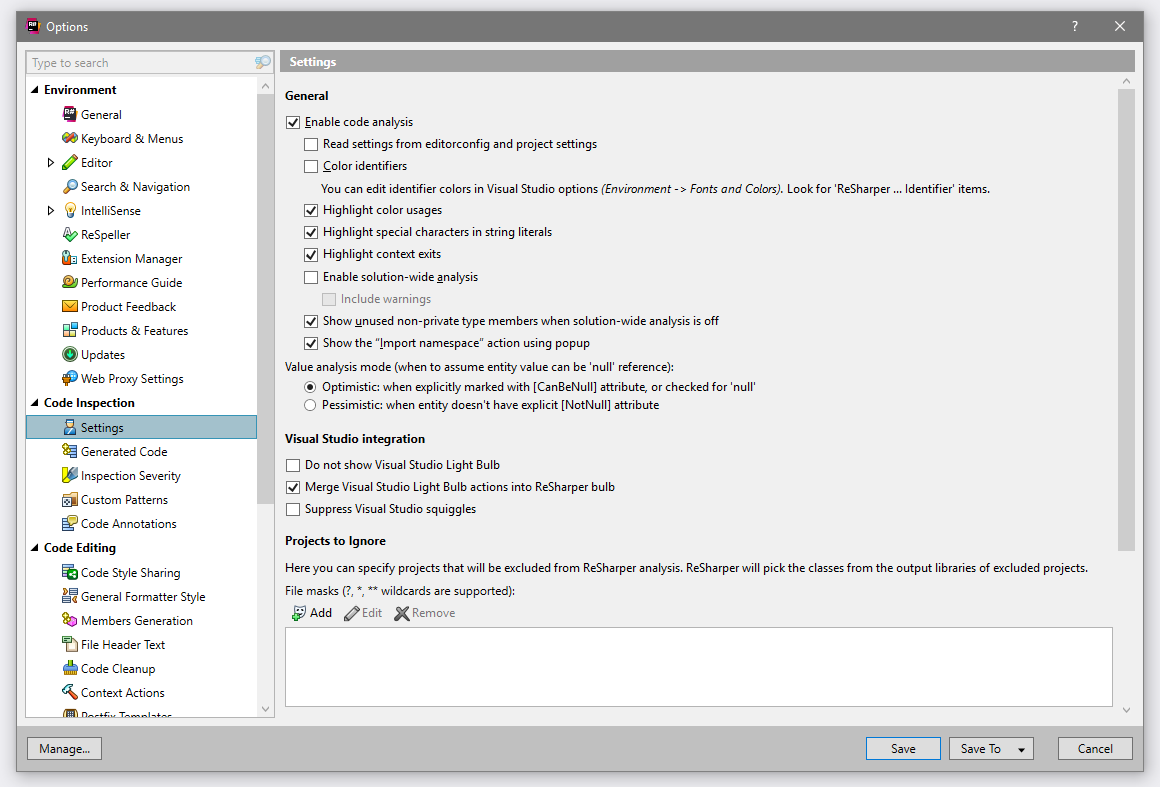
If the Merge Visual Studio Light Bulb actions into ReSharper bulb setting is enabled then Wallaby quick actions will be also available when you use Alt + Enter.
Troubleshooting
If you encounter any issues with configuring or using Wallaby and are not sure why it happens, check out our troubleshooting docs section or search our public repository issues to see if someone else has experienced something similar.