AI Coding Agents
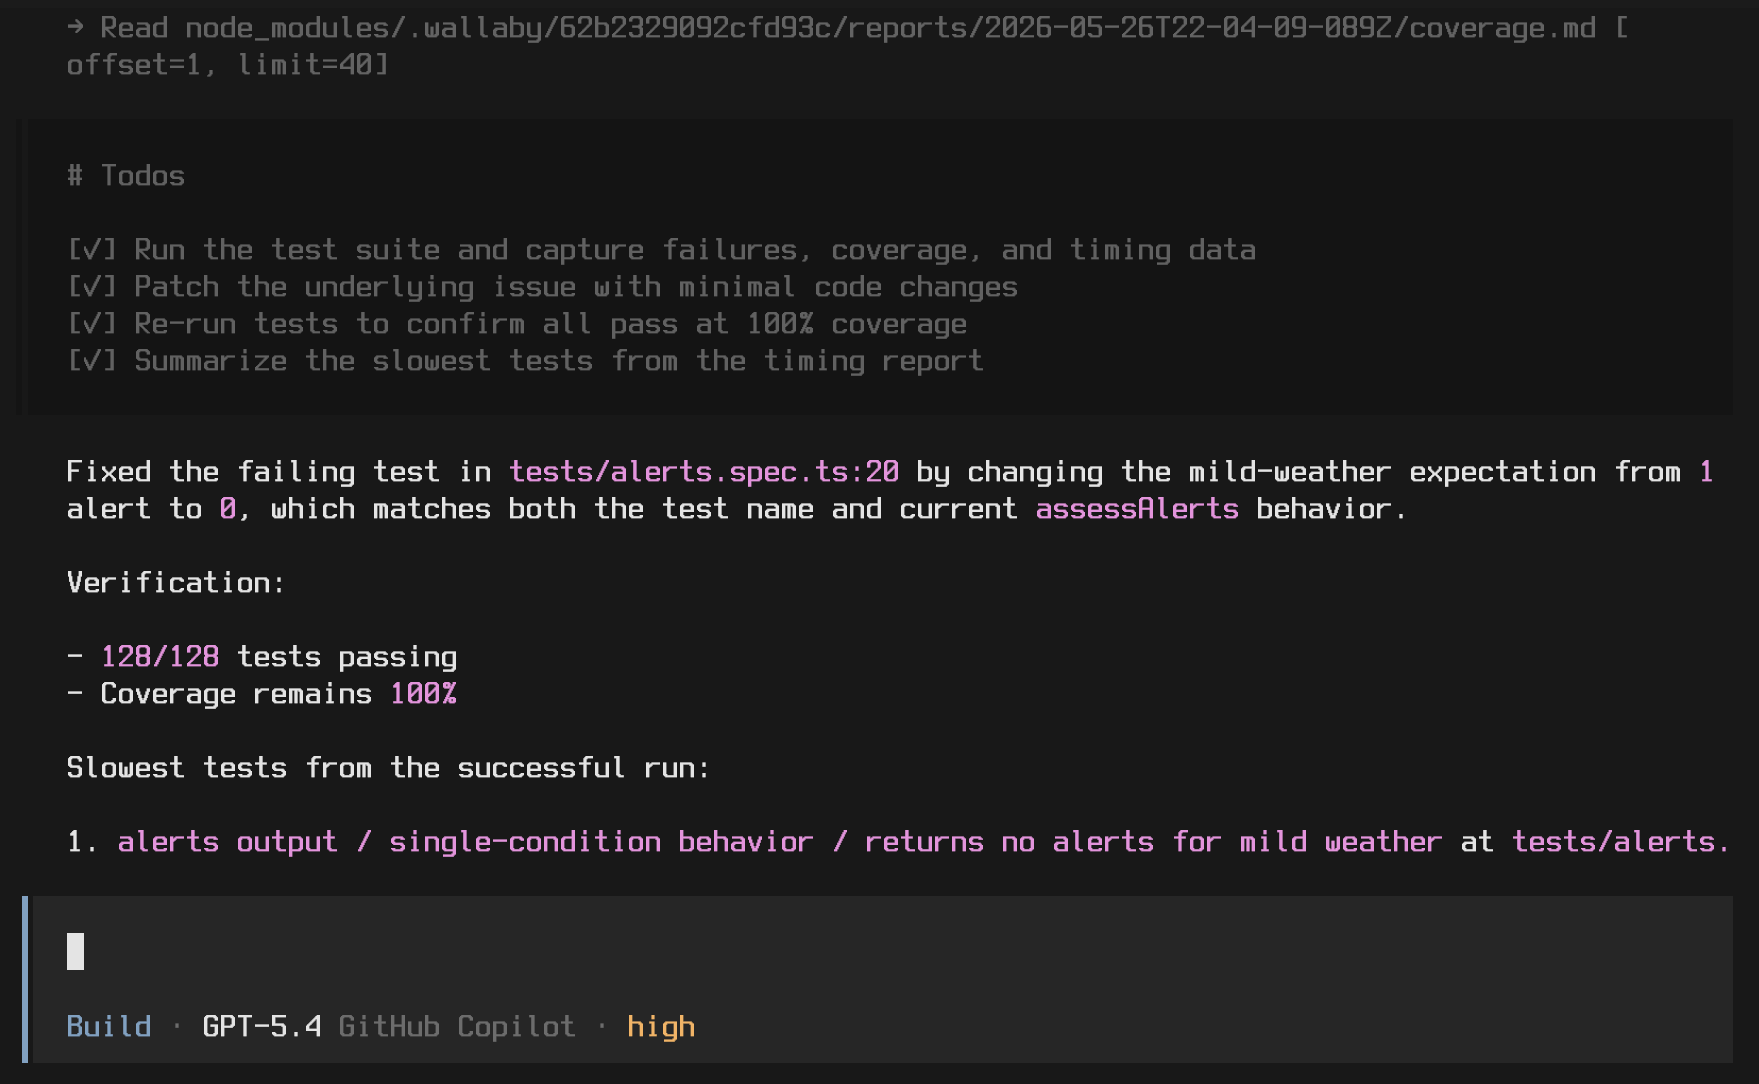
Wallaby skills and MCP (Model Context Protocol) server integrate with various AI coding agents, providing real-time runtime context from your codebase and test environment. These tools help agents analyze, generate, debug, and improve code with direct access to test results, coverage, execution paths, and runtime values, whether they run locally, in a container, or in the cloud.
Getting Started
Depending on your workflow and coding agent, use one of these Wallaby AI tools:
- Copilot Agent Integration: Use this when you are working with Github Copilot Agent in VS Code and Wallaby is already running in your open editor. Wallaby automatically exposes the tools the agent needs for the current workspace.
- Skills: Use these for agents running either inside or outside your editor, especially when you want a portable
setup that works whether Wallaby is already running or needs to be started for the agent. This is the recommended setup
for:
- CLI agents such as Claude Code, Codex CLI, Copilot CLI, OpenCode, and Pi, including workflows that use git worktrees.
- Agent apps such as Claude Code, Codex App, VS Code Agents, Copilot App, Cursor, Windsurf, and OpenCode Desktop.
- Agents running in containers, cloud/remote environments, or anywhere the Wallaby editor extension is not installed, including GitHub Copilot Cloud Agents, Docker, Podman, WSL, Apple containers, VS Code Dev Containers, and DevPod.
- MCP Server: Use this when your agent supports MCP directly but does not support skills, or when you prefer not to install Wallaby skills. The skills can connect to a running Wallaby instance or start one when needed; the MCP server can only connect to Wallaby after it is already running in your editor.
For most non-Copilot workflows, start with Skills.
- Skills: Use these for agents running either inside or outside your editor, especially when you want a portable
setup that works whether Wallaby is already running or needs to be started for the agent. This is the recommended setup
for:
- CLI agents such as Claude Code, Codex CLI, Copilot CLI, OpenCode, and Pi, including workflows that use git worktrees.
- Agent apps such as Claude Code, Codex App, VS Code Agents, Copilot App, Cursor, Windsurf, and OpenCode Desktop.
- Agents running in containers, cloud/remote environments, or anywhere the Wallaby editor extension is not installed, including GitHub Copilot Cloud Agents, Docker, Podman, WSL, Apple containers, VS Code Dev Containers, and DevPod.
- MCP Server: Use this when your agent supports MCP directly but does not support skills, or when you prefer not to install Wallaby skills. The skills can connect to a running Wallaby instance or start one when needed; the MCP server can only connect to Wallaby after it is already running in your editor.
Copilot Agent
To use Wallaby’s built-in Copilot Agent integration, no additional setup is required. Start Wallaby in VS Code, and Wallaby automatically makes its AI tools available to Copilot for the current workspace.
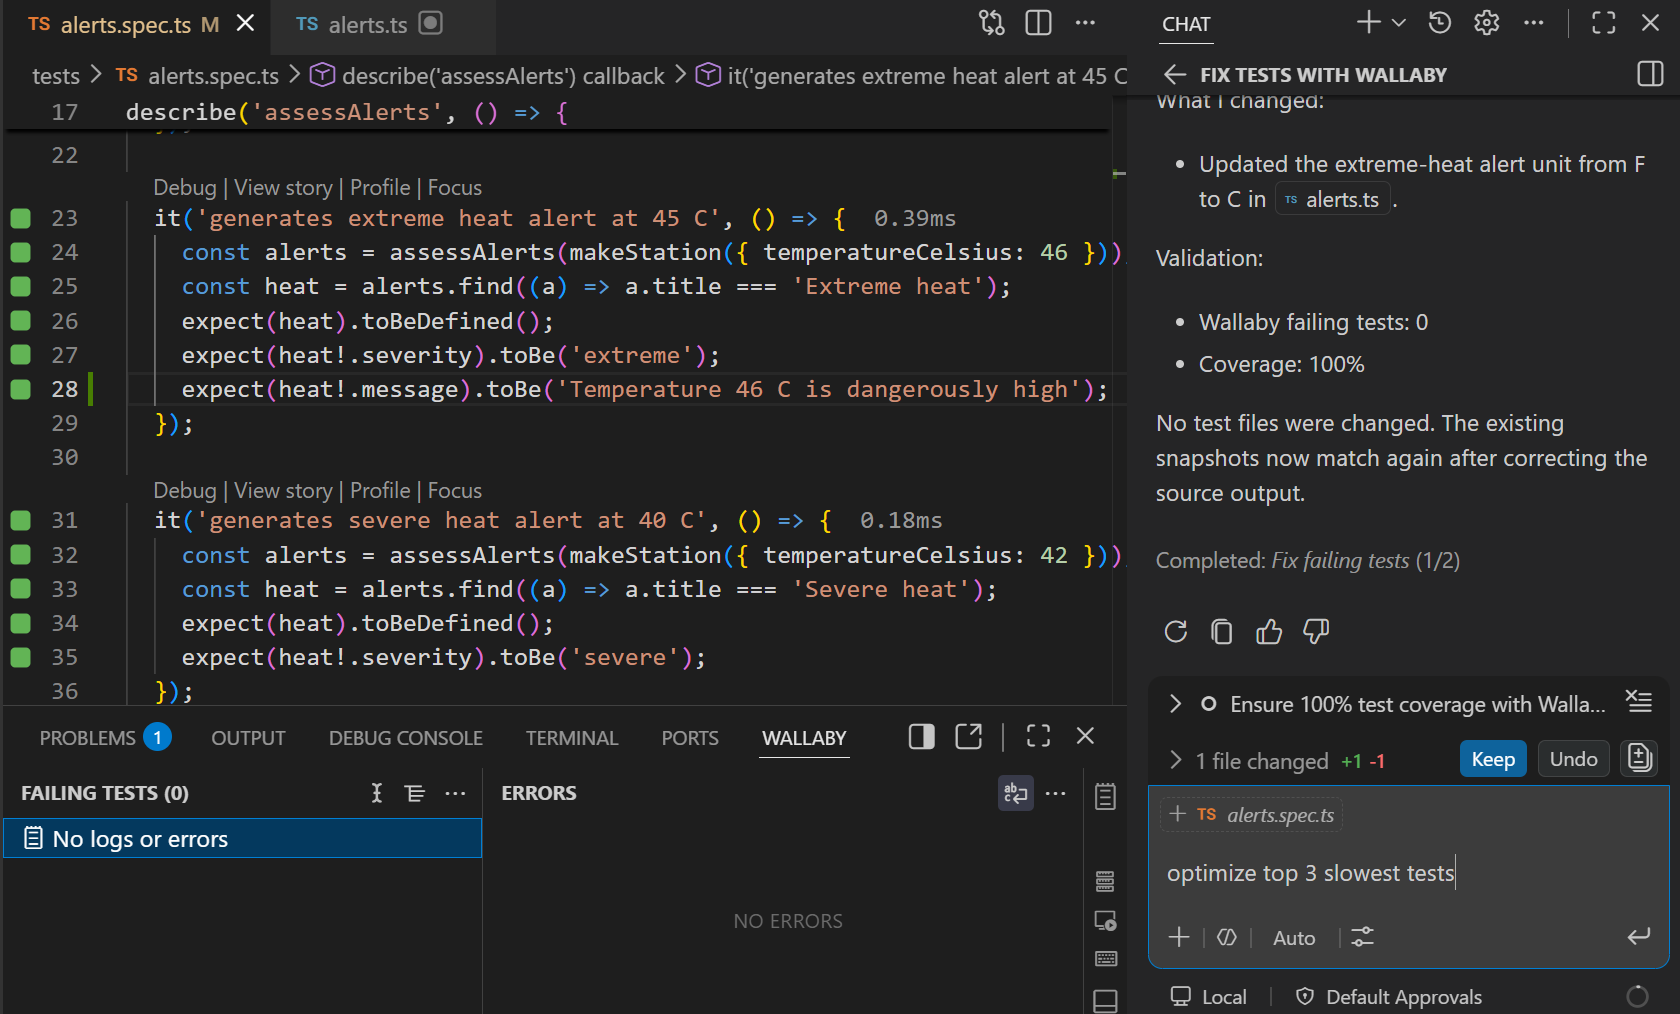
The best AI model for investigating unit test errors is the one with the most context, provided by the user and the right tools. Wallaby gives AI the context it needs: execution paths, test coverage, and runtime values.
Investigate with AI
When you use Copilot in VS Code, you can also use the Investigate with AI icon next to a failing test. The command is
also available from the Command Palette and the code lens above the failing test.
Wallaby allows you to choose between different modes of operation, such as Investigation, Analytical Fix and Direct Fix.
- Investigation mode provides in-depth analysis of the failing test, outlining possible causes and next steps. The LLM is instructed not to modify code in this mode.
- Analytical Fix mode performs a detailed analysis using all available tools, ideal for complex or unclear failures.
- Direct Fix mode analyzes the issue and applies a fix with minimal explanation, best for straightforward problems.
After you choose a mode, Wallaby opens a new Copilot Chat and asks the AI model to investigate or fix the failing test. The AI model analyzes the provided error details and may then request additional context from Wallaby, such as:
- Code coverage: Wallaby provides not only the percentage figure / overall coverage of all tests, but also the exact execution path that led to the failure. With this information, the AI model knows what lines of code were specifically executed by the failing test and doesn’t need to guess to provide more accurate results.
- Runtime values: Similar to how you can hover over any source code expression to explore its value with Wallaby, the AI model can ask Wallaby for the runtime values of any expression in the code to support its investigation.
Wallaby displays the investigation results in the chat and applies the fix to your code if you choose to do so.
Custom Instructions
To get the most out of Wallaby’s Copilot integration, add the following custom instruction. It helps Copilot treat Wallaby as the first place to inspect tests, coverage, and runtime values before reaching for the terminal or Problems panel.
- Open the command palette (Ctrl/Cmd+Shift+P) and run
Chat: Configure Instructions. - Select
Create new instruction file.... - Select where you want to save the instruction file (i.e for your project or globally); we recommend saving it
globally (
User Data Folder). - Name the file when prompted (e.g.
JavaScript/TypeScript Test Operations). - Set the following instruction to the file:
---applyTo: '**'---
# Test Guidelines
## Use Wallaby.js first
- Use Wallaby.js for test results, errors, and debugging- Leverage runtime values and coverage data when debugging tests- Fall back to terminal only if Wallaby isn't available
1. Analyze failing tests with Wallaby and identify the cause of the failure.2. Use Wallaby's covered files to find relevant implementation files or narrow your search.3. Use Wallaby's runtime values tool and coverage tool to support your reasoning.4. Suggest and explain a code fix that will resolve the failure.5. After the fix, use Wallaby's reported test state to confirm that the test now passes.6. If the test still fails, continue iterating with updated Wallaby data until it passes.7. If a snapshot update is needed, use Wallaby's snapshot tools for it.
When responding:- Explain your reasoning step by step.- Use runtime and coverage data directly to justify your conclusions.
You can further improve how an agent works with Wallaby by manually installing a custom SKILL.md file. This gives the
agent durable, tool-specific guidance about when to use Wallaby, which data to request for failures, coverage, and runtime
values, and how to turn those results into more accurate test debugging and code fixes.
SKILL.md
---name: wallaby-testingdescription: Check test status and debug failing tests using Wallaby.js real-time test results. Use after making code changes to verify tests pass, when checking if tests are failing, debugging test errors, analyzing assertions, inspecting runtime values, checking coverage, updating snapshots, or when user mentions Wallaby, tests, coverage, or test status.compatibility: Requires Wallaby.js VS Code extension installed and runningmetadata:  author: wallaby.js  version: "1.0"---
# Wallaby Testing Skill
Check test status and debug failing tests using Wallaby.js real-time test execution data.
## When to Use
- **After code changes** - Verify tests pass after modifications- **Checking test status** - See if any tests are failing- **Debugging failures** - Analyze test errors and exceptions- **Inspecting runtime values** - Examine variable states during tests- **Understanding coverage** - See which code paths tests execute- **Updating snapshots** - When snapshot changes are needed- User mentions "tests", "test status", "run tests", or "Wallaby"
## Available Wallaby Tools
Use these tools to gather test information:
| Tool | Purpose ||------|---------|| `wallaby_failingTests` | Get all failing tests with errors and stack traces || `wallaby_failingTestsForFile` | Get failing tests for a specific file || `wallaby_allTests` | Get all tests (useful when there are no failures but you need test IDs) || `wallaby_allTestsForFile` | Get tests covering/executing a specific file || `wallaby_failingTestsForFileAndLine` | Get failing tests covering/executing a specific file and line || `wallaby_allTestsForFileAndLine` | Get tests covering a specific line || `wallaby_runtimeValues` | Inspect variable values at a code location || `wallaby_runtimeValuesByTest` | Get runtime values for a specific test || `wallaby_coveredLinesForFile` | Get coverage data for a file || `wallaby_coveredLinesForTest` | Get lines covered by a specific test || `wallaby_testById` | Get detailed test data by ID || `wallaby_updateTestSnapshots` | Update snapshots for a test || `wallaby_updateFileSnapshots` | Update all snapshots in a file || `wallaby_updateProjectSnapshots` | Update all snapshots in the project |
### What Inputs These Tools Need
- **For file-scoped tools** (like `wallaby_failingTestsForFile`, `wallaby_coveredLinesForFile`): pass the workspace-relative file path.- **For line-scoped tools** (like `wallaby_allTestsForFileAndLine`, `wallaby_runtimeValues`): pass `file`, `line`, and the exact `lineContent` string from the file.- **For test-scoped tools** (like `wallaby_testById`, `wallaby_runtimeValuesByTest`, `wallaby_coveredLinesForTest`): pass `testId` from `wallaby_failingTests` / `wallaby_allTests`.
## Debugging Workflow
### Step 1: Get Failing Tests
Start by retrieving failing test information:- Use `wallaby_failingTests` to see all failures- Review error messages and stack traces- Note the test ID for further inspection
If there are no failing tests but the user is asking about test status or coverage, use `wallaby_allTests` to confirm the current state and to obtain test IDs.
### Step 2: Locate Related Code (Optional)
If the error and stack trace from Step 1 don't provide enough context:- Use `wallaby_coveredLinesForTest` with the test ID- Focus analysis on covered source files- Identify which code paths are executed- Skip this step if the failure cause is already clear
### Step 3: Inspect Runtime Values (Optional)
Examine variable states at failure points or other points of interest:- Use `wallaby_runtimeValues` for specific locations- Use `wallaby_runtimeValuesByTest` for test-specific values- Compare expected vs actual values- Skip this step if the failure cause is already clear
### Step 4: Implement Fix
Based on analysis:- Identify the root cause- Make targeted code changes- Reference runtime values in your explanation
### Step 5: Verify Fix
After changes:- Wallaby re-runs tests automatically- Use `wallaby_testById` to confirm test passes- Check no regressions with `wallaby_failingTests`
### Step 6: Update Snapshots (if needed)
When snapshots need updating:- Use `wallaby_updateTestSnapshots` for specific tests- Use `wallaby_updateFileSnapshots` for all in a file- Use `wallaby_updateProjectSnapshots` only when many snapshots changed- Verify tests pass after updates
## Example: Debugging an Assertion Failure
<example>User: "The calculator test is failing"
1. Call wallaby_failingTests → Get test ID and error   Error shows: "expected 4, got 5" in multiply function2. (Optional) Call wallaby_coveredLinesForTest(testId) → Skip if error is clear3. (Optional) Call wallaby_runtimeValues(file, line, expression) → Skip if cause is obvious4. Analyze: multiply used + instead of *5. Fix: Change + to * in calculator.js6. Call wallaby_failingTests → Confirm no failures remain</example>
## Best Practices
- **Use Wallaby tools first** - They provide real-time data without re-running tests- **Get test IDs early** - Many tools require the test ID from initial queries- **Inspect runtime values** - More reliable than guessing variable states- **Verify after fixes** - Always confirm the test passes before finishing- **Check for regressions** - Ensure fixes don't break other tests
Skills
The wallaby skill provides workflows for
writing new tests and improving existing ones. Use wallaby write to add tests and wallaby improve to find gaps and
strengthen existing tests. These workflows use the
wallaby-cli skill, which acts as Wallaby’s
API for agents, giving them access to everything you can do with Wallaby. An agent can also select wallaby-cli
automatically during a coding task.
See Wallaby for Coding Agents for examples of how agents use these skills with live test and runtime data.
Install the skills to your project:
gh skill install wallabyjs/skillsor:
npx skills add wallabyjs/skillsInvoke wallaby with a subcommand and a target or instructions:
Implement the feature described in <GitHub issue URL> and add tests using /wallaby write/wallaby write tests for the current changes/wallaby write tests for account suspension and reactivation/wallaby improve src/accounts//wallaby improve the files changed in this branch/wallaby improve files with coverage below 90%wallaby write works through new tests one at a time. For each test, the agent states the behavior and source paths it
expects to exercise, then checks the test’s result, coverage, and assertions against that prediction. It also considers
boundaries and failure paths within the requested scope.
wallaby improve reviews existing tests for meaningful gaps, including uncovered branches, weak assertions, and
untested boundary or failure behavior. You can target a file, directory, or Git change set and specify a coverage or
other selection criterion. Without a target or criterion, it reviews source files with coverage at or below 95%.
Coverage helps select candidates, but a higher percentage alone does not finish the review: the agent checks whether the
tests would catch plausible defects and explains any remaining gaps.
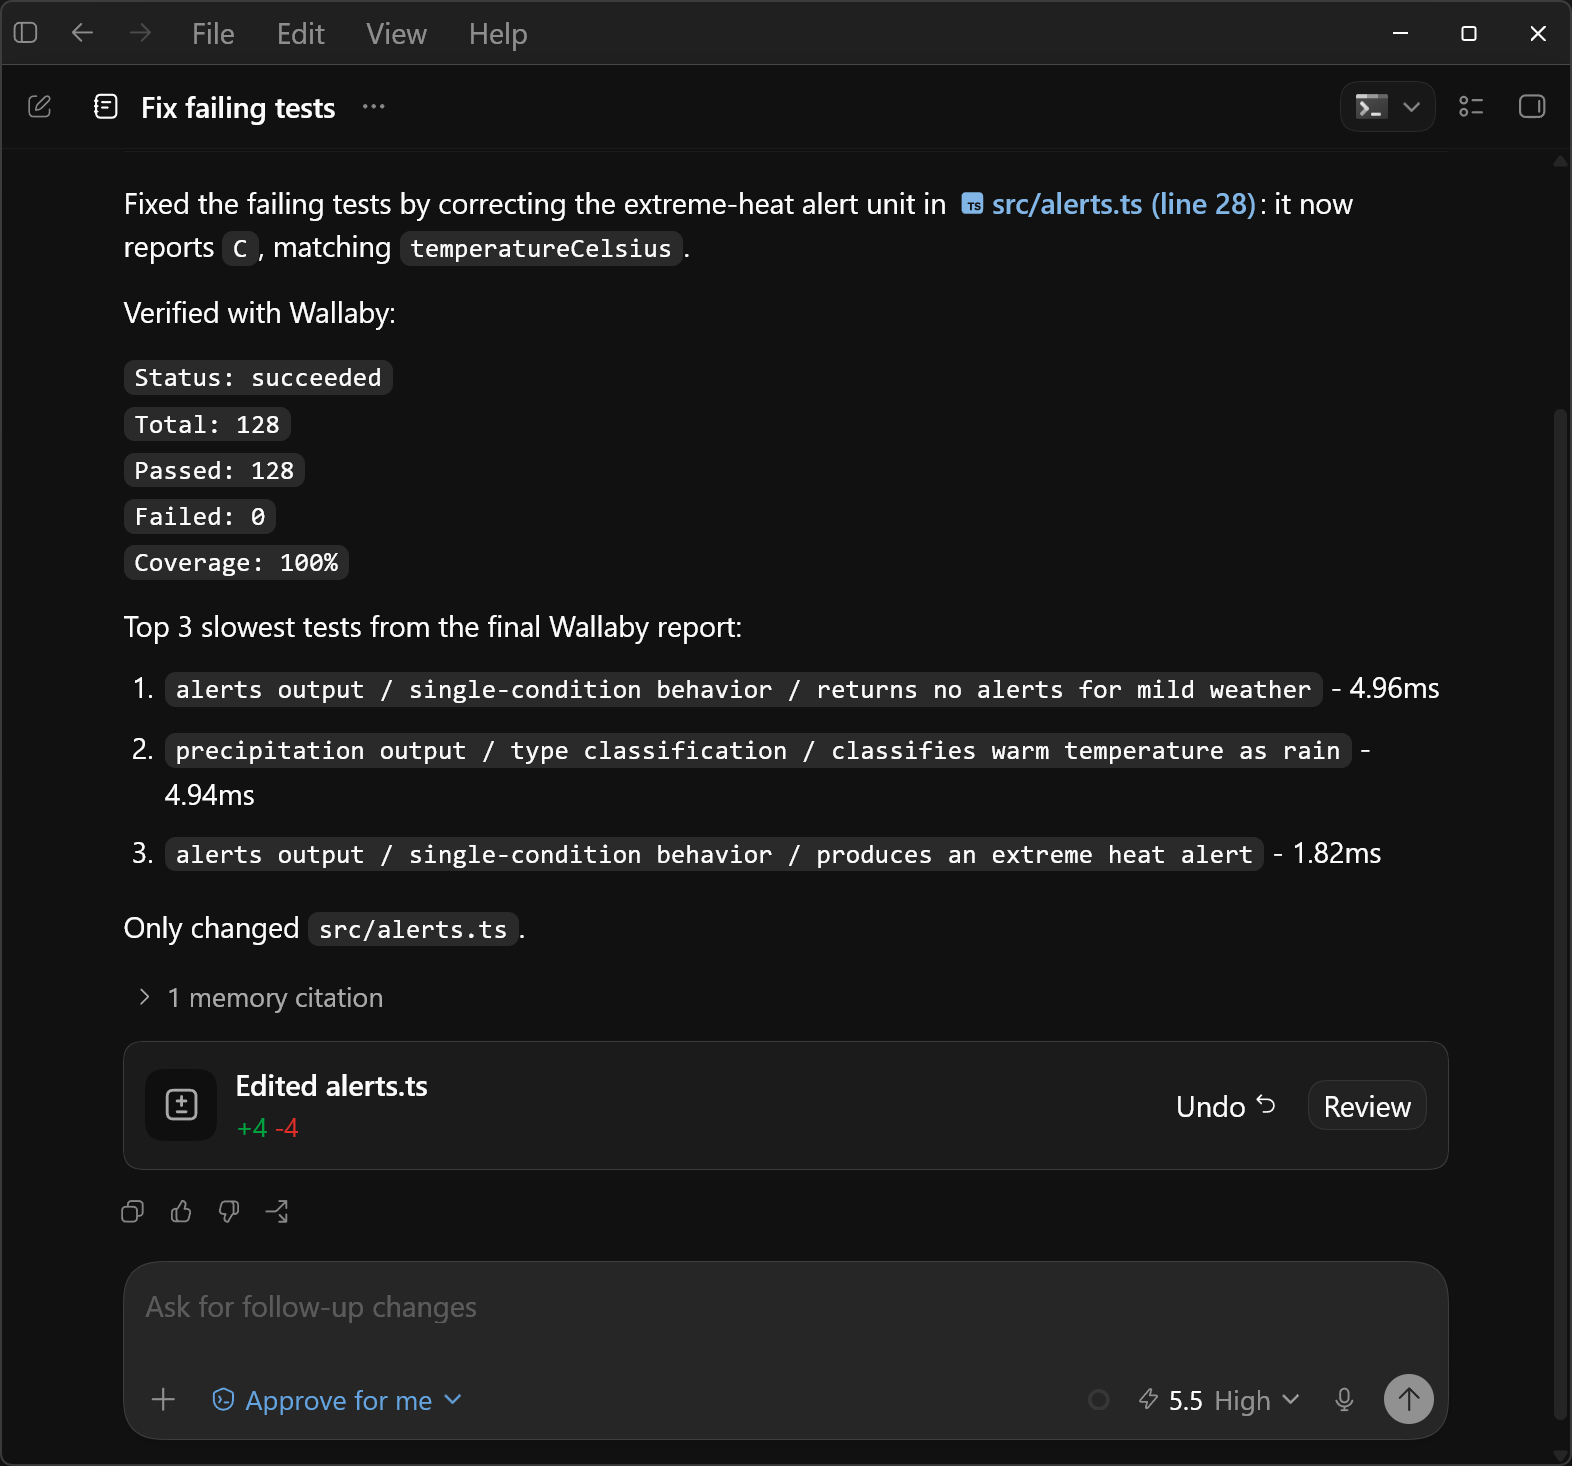
You can also ask the agent to check test results, diagnose a failure, or verify a change with wallaby-cli. It can start
with a project-wide baseline or focus on relevant test files. Wallaby runs your existing tests through their framework,
reruns affected tests as files change, and keeps the latest results available to the agent.
Run the tests and fix all failing tests using wallabyThe skill gives the agent concise reports for test status, failures, coverage, and timings. When it needs more detail, the agent can inspect several files in one report, find which tests cover a source line or expression, trace a test across files, or capture runtime values for specific tests without changing your code. It can also compare saved reports to current results and update snapshots when the output change is intentional.
You can use your project’s AGENTS.md to tell the agent when to use Wallaby and which configuration
file to use:
Use the wallaby-cli skill to run, investigate, and verify unit tests for the project.Use `./wallaby.unit.js` as the configuration file.If Wallaby is already running in your editor, wallaby-cli connects to that instance, and you can see the agent’s test
and coverage activity there. Otherwise, it starts a background instance. To inspect results yourself or monitor the
agent, ask it to open the Wallaby UI in a browser. The background instance stops
when the CLI agent session ends, when the agent requests it, or after a period of inactivity.
The wallaby-cli skill uses Wallaby CLI and installs it when needed.
If you prefer not to install Wallaby CLI globally, add it as a development dependency in your project:
npm install --save-dev @wallabyjs/cliBeta Access
If you already use Wallaby and have a licensed Wallaby extension installed on your machine, you can use the skills locally without a separate beta access request.
If you are new to Wallaby, you can request free beta access to Wallaby CLI:
npx --package @wallabyjs/cli wallaby accessIf Wallaby CLI is already installed, you can run wallaby access directly.
Enter your email address when prompted. You will receive an email with an activation link. After activation, you can use the skills locally on that machine while Wallaby CLI is in beta.
CLI activation does not start an editor trial. To try Wallaby in your editor, follow the installation instructions.
Sandbox configuration
Sandboxed coding agents need write access to ~/.wallaby and must be able to connect to Wallaby’s update and
telemetry servers. For example, when using Codex, add the following
configuration to .codex/config.toml:
[sandbox_workspace_write]network_access = truewritable_roots = ["~/.wallaby"]
[features.network_proxy]enabled = truedomains = { "localhost" = "allow", "127.0.0.1" = "allow", "::1" = "allow", "*.wallabyjs.com" = "allow", "www.google-analytics.com" = "allow" }
If the @wallabyjs/cli package is not installed locally, also add "registry.npmjs.org" = "allow" to the domains
map so the wallaby-cli skill can install it.
Containers and Cloud Agents
Running Wallaby in a containerized or cloud environment is currently in beta for all users. These environments require
a WALLABY_CLI_TOKEN environment variable.
Token-based access may require separate paid access after the beta, even if you already have a Wallaby license.
Existing Wallaby users can create the token from a machine with a licensed Wallaby extension installed:
npm install -g @wallabyjs/cliwallaby accessIf you are new to Wallaby and have not requested beta access yet, the command will ask for your email address and send
you an activation link. After activation, it will create a WALLABY_CLI_TOKEN.
For containers, export the token into your shell and pass it at runtime:
eval "$(wallaby access --env)"docker run --env WALLABY_CLI_TOKEN ...For PowerShell, export the token into your current session and pass it at runtime:
wallaby access --env --shell pwsh | Invoke-Expressiondocker run --env WALLABY_CLI_TOKEN ...For scripts or CI setup, request only the token value:
export WALLABY_CLI_TOKEN="$(wallaby access --raw)"docker run --env WALLABY_CLI_TOKEN ...You can also write the token to an uncommitted local environment file:
wallaby access --file .envdocker run --env-file .env ...For Docker Compose, prefer host environment interpolation:
services: app: environment: WALLABY_CLI_TOKEN: ${WALLABY_CLI_TOKEN}For Dev Containers, use host environment interpolation instead of committed token values:
{ "remoteEnv": { "WALLABY_CLI_TOKEN": "${localEnv:WALLABY_CLI_TOKEN}" }}Keep WALLABY_CLI_TOKEN out of source control:
- Do not put
ENV WALLABY_CLI_TOKEN=...in a Dockerfile. - Do not commit the token into
devcontainer.json,docker-compose.yml,.env, shell scripts, or CI config. - Do not bake one user’s token into a team image.
- Prefer runtime environment injection, platform secrets, host environment interpolation, or an uncommitted local env file.
For cloud agents, provide WALLABY_CLI_TOKEN through the agent platform’s secret management. For example, in GitHub
Copilot Cloud Agent, add the WALLABY_CLI_TOKEN secret in
Settings -> Secrets and variables -> Agents secrets and variables. You may also need to allow outbound access to
wallabyjs.com in Settings -> Copilot -> Cloud Agent -> Custom Allowlist. GitHub applies this rule to the domain and
all its subdomains.
MCP Server
Use the Wallaby MCP server when your agent supports MCP directly but does not support skills, or when you prefer not to
install the wallaby-cli skill. The main functional difference is lifecycle management: the skill can start a Wallaby
instance in the background when needed, while the MCP server connects to an existing Wallaby instance running in your
editor or in standalone mode.
In VS Code, run Wallaby: Open MCP Settings to configure the MCP server for your agent. After configuring it, make
sure Wallaby is running by using the Wallaby.js: Start command from the command palette. The agent can then request
Wallaby runtime context through MCP tools.
To configure the Wallaby MCP server for your AI agent manually, add the following configuration to your agent’s MCP settings:
{ "mcpServers": { "wallaby": { "command": "npx", "args": [ "-y", "-c", "node ~/.wallaby/mcp" ] } }}Depending on your agent and operating system, the exact format may vary. Refer to your agent’s documentation for more details on how to add MCP servers. For example, to add the Wallaby MCP server to Claude Code, run the following command in the terminal:
claude mcp add wallaby -s project -- npx "-y" "-c" "node ~/.wallaby/mcp"If you get the Connection failed: spawn node error after adding the MCP server, Claude Code’s MCP client may not be able
to find your Node.js executable. In that case, replace node with the full path to the Node.js executable on your system,
for example:
claude mcp add wallaby -s project -- npx "-y" "-c" "/full/path/to/node ~/.wallaby/mcp"How It Works
Without Wallaby, AI agents work with limited context. They can usually see generic test runner output, IDE problem lists, and test panels. That information shows what failed, but it often does not explain the runtime behavior, execution paths, or relationships between tests and source code.
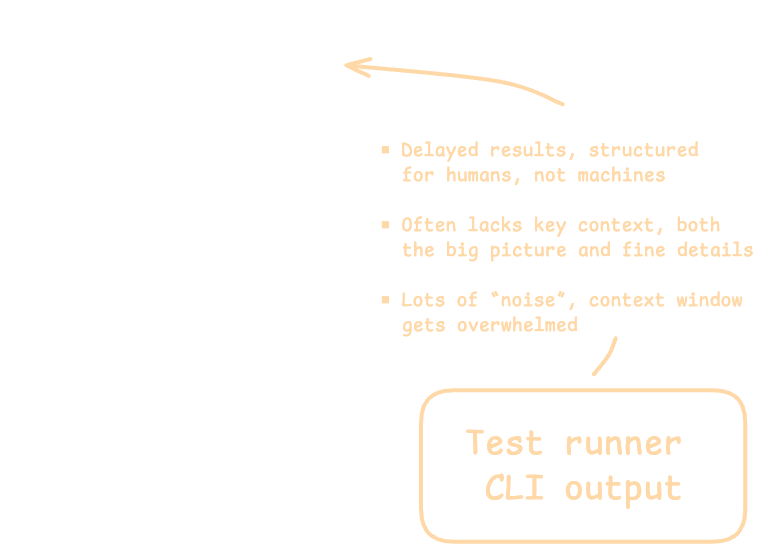
This makes it harder for agents to debug complex issues or write tests that depend on runtime behavior.
With Wallaby, agents can request live runtime context as they need it. This context includes:
- Real-time runtime values without modifying code
- Complete execution paths for specific tests or entire projects
- Branch-level code coverage analytics
- Detailed code dependency graphs
- Test snapshot management capabilities
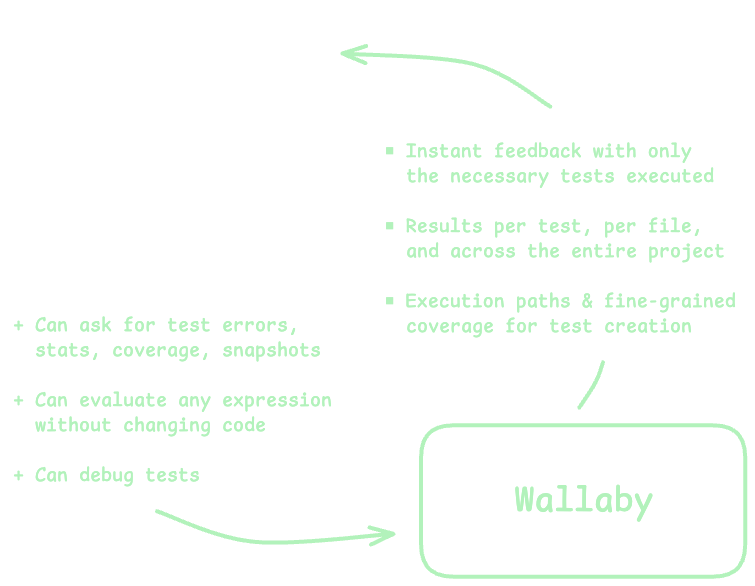
With that context, agents can analyze failures, debug behavior, and create code or tests with fewer guesses.
Tools
The wallaby-cli skill and the Wallaby MCP server expose similar AI tools. Agents can use these tools to request runtime
context from your project as they work.
Tests
Access test status, errors, logs, and coverage. Agents can retrieve:
- Lists of failing or all tests
- Tests for specific files, lines, or source files
- Detailed test errors and logs
- Aggregated code coverage data
- Global application errors and logs
- Execution traces showing source lines in execution order across files for a specific test
Example applications:
- Start with failing tests before changing code
- Inspect a specific test to understand its execution path and failure details
Runtime Values
Evaluate variables, object state, function return values, or any other valid code expression without modifying code.
Values can be requested for all tests or filtered to specific test contexts.
Example applications:
- Debug by examining variable states at specific execution points
- Verify expected behaviors by comparing actual vs. expected values
- Trace how data changes through an execution path
Code Coverage
Access branch-level coverage data to:
- Identify execution paths for specific tests
- Map relationships between tests and source code
- Find uncovered code that needs tests
Example applications:
- Analyze execution paths by inspecting covered lines for specific tests
- Find tests affected by code changes by identifying which tests cover specific lines
- Understand test dependencies before refactoring or adding features
Snapshot Management
Update test snapshots after intentional behavior changes.
Snapshots can be updated for a specific test, a file, or the whole project.
Example Use Cases
Here are some example prompts for using Wallaby skills with your coding agent.
Write New Tests
/wallaby write tests for the current changes/wallaby write tests for account suspension and reactivation/wallaby write a regression test for the bug described in <GitHub issue URL>Implement the feature described in <GitHub issue URL> and add tests using /wallaby write
Improve Existing Tests
/wallaby improve src/accounts//wallaby improve the files changed in this branch/wallaby improve files with coverage below 90%/wallaby improve src/checkout/ focusing on weak assertions and missing boundary cases
Run and Debug Tests
Run the tests and fix all failing tests using wallabyUse wallaby to run only the account and checkout tests and investigate any failuresUse wallaby to trace the failing "coupon / rejects an expired coupon" test through setup and source code. Inspect the runtime values that explain the failure, fix the cause, and verify the result.The "coupon / accepts a valid coupon" test passes unexpectedly. Use wallaby to trace it and check whether it reaches the validation logic
Explore Coverage and Runtime Behavior
Use wallaby to compare coverage gaps across the account and checkout modules, including partially covered expressionsUse wallaby to investigate the incorrect checkout total by inspecting discount, tax, and total values in the failing testUse wallaby to find the slowest tests and explain what makes them slow
Verify Changes and Update Snapshots
For a feature or refactor, ask the agent to capture the current state before editing, verify affected tests as it works, and check the full project before finishing:
Before implementing this feature, use Wallaby to capture the current full-project test and coverage state and identifythe tests that cover the code you expect to change. Then implement the feature, verify the affected tests first, andcheck the full project state for failures or coverage regressions.For an existing baseline or an intentional snapshot change:
Use wallaby to compare the current test results and coverage with the baseline saved before this refactorUse wallaby to update the receipt snapshots for the new formatting and verify the affected tests