JetBrains IDEs
Wallaby provides the following features in your editor:
- realtime feedback for errors and any expressions in your code,
- realtime code coverage updated as you type,
- time travel debugger with edit-and-continue and interactive timeline,
- value explorer for viewing runtime values,
- running and focussing on selected tests,
- quick navigation to failing tests/error sources,
- close to instant incremental test execution,
- code coverage explorer and test explorer,
- compact & side-by-side diff views, and much more.
How to configure Wallaby
For many popular testing environments (Jest v24+, Vitest, node:test , Angular CLI v8.2+, Create React App v3+, NX Workspaces v8+, Vue CLI v4+), Wallaby can be started with no configuration. For the full list of settings, refer to configuration documentation.
How to start Wallaby on your project
Wallaby for JetBrains IDEs needs to know what configuration is required to run your tests. To configure Wallaby,
create a new Wallaby Run Configuration by selecting Edit configurations from the drop-down menu in the
top right-hand corner of the navigation bar, or from the Run menu.
If you are using a technology that is supported by automatic configuration, then set your run configuration’s
Configuration Type value to Automatic. If you have a mono-repo and only want to run for one project then
set the Root Path to your project folder.
If your project does not support automatic configuration then you will first need to create a configuration file in your project’s root and select this as your Configuration File in your Run Configuration. You can read more about the configuration file format and other settings in the configuration section.
Once you have saved your Run Configuration, you can start Wallaby by running it.
To stop Wallaby, stop the Run Configuration.
Instant Affected Test Execution
Wallaby re-runs only the tests affected by your latest code changes, whether files are uncommitted, in source control, or unsaved. This makes Wallaby the fastest JavaScript test runner available.
Code Coverage
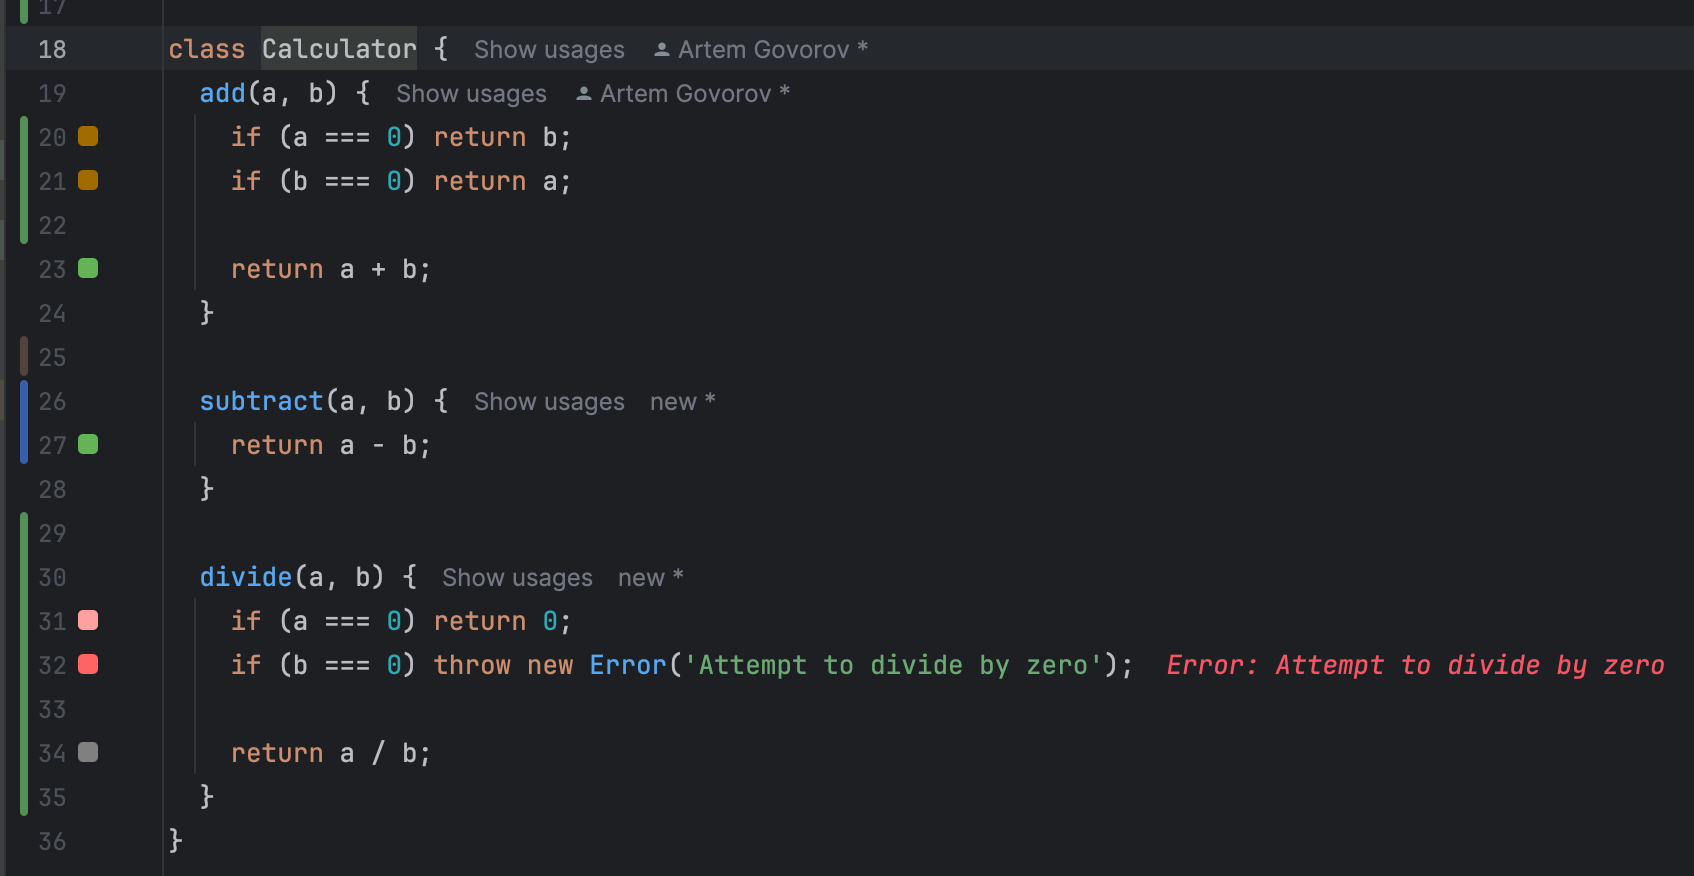
Wallaby calculates code coverage as it runs your tests, showing which parts of your code have been executed and which haven’t. Coverage is displayed in the left margin of your editor and updates in real time as you make changes. Coverage indicators are more than just a report—they help you continuously verify that your code changes are affecting the right parts of your source code.
Error Reporting
Errors are inevitable when writing tests and code. Handling them efficiently without context switching can save you hours, and it’s one of the reasons Wallaby is the most advanced JavaScript test runner today. Wallaby offers powerful tools to quickly discover, navigate, analyze, and fix test errors.
Inline Error Details
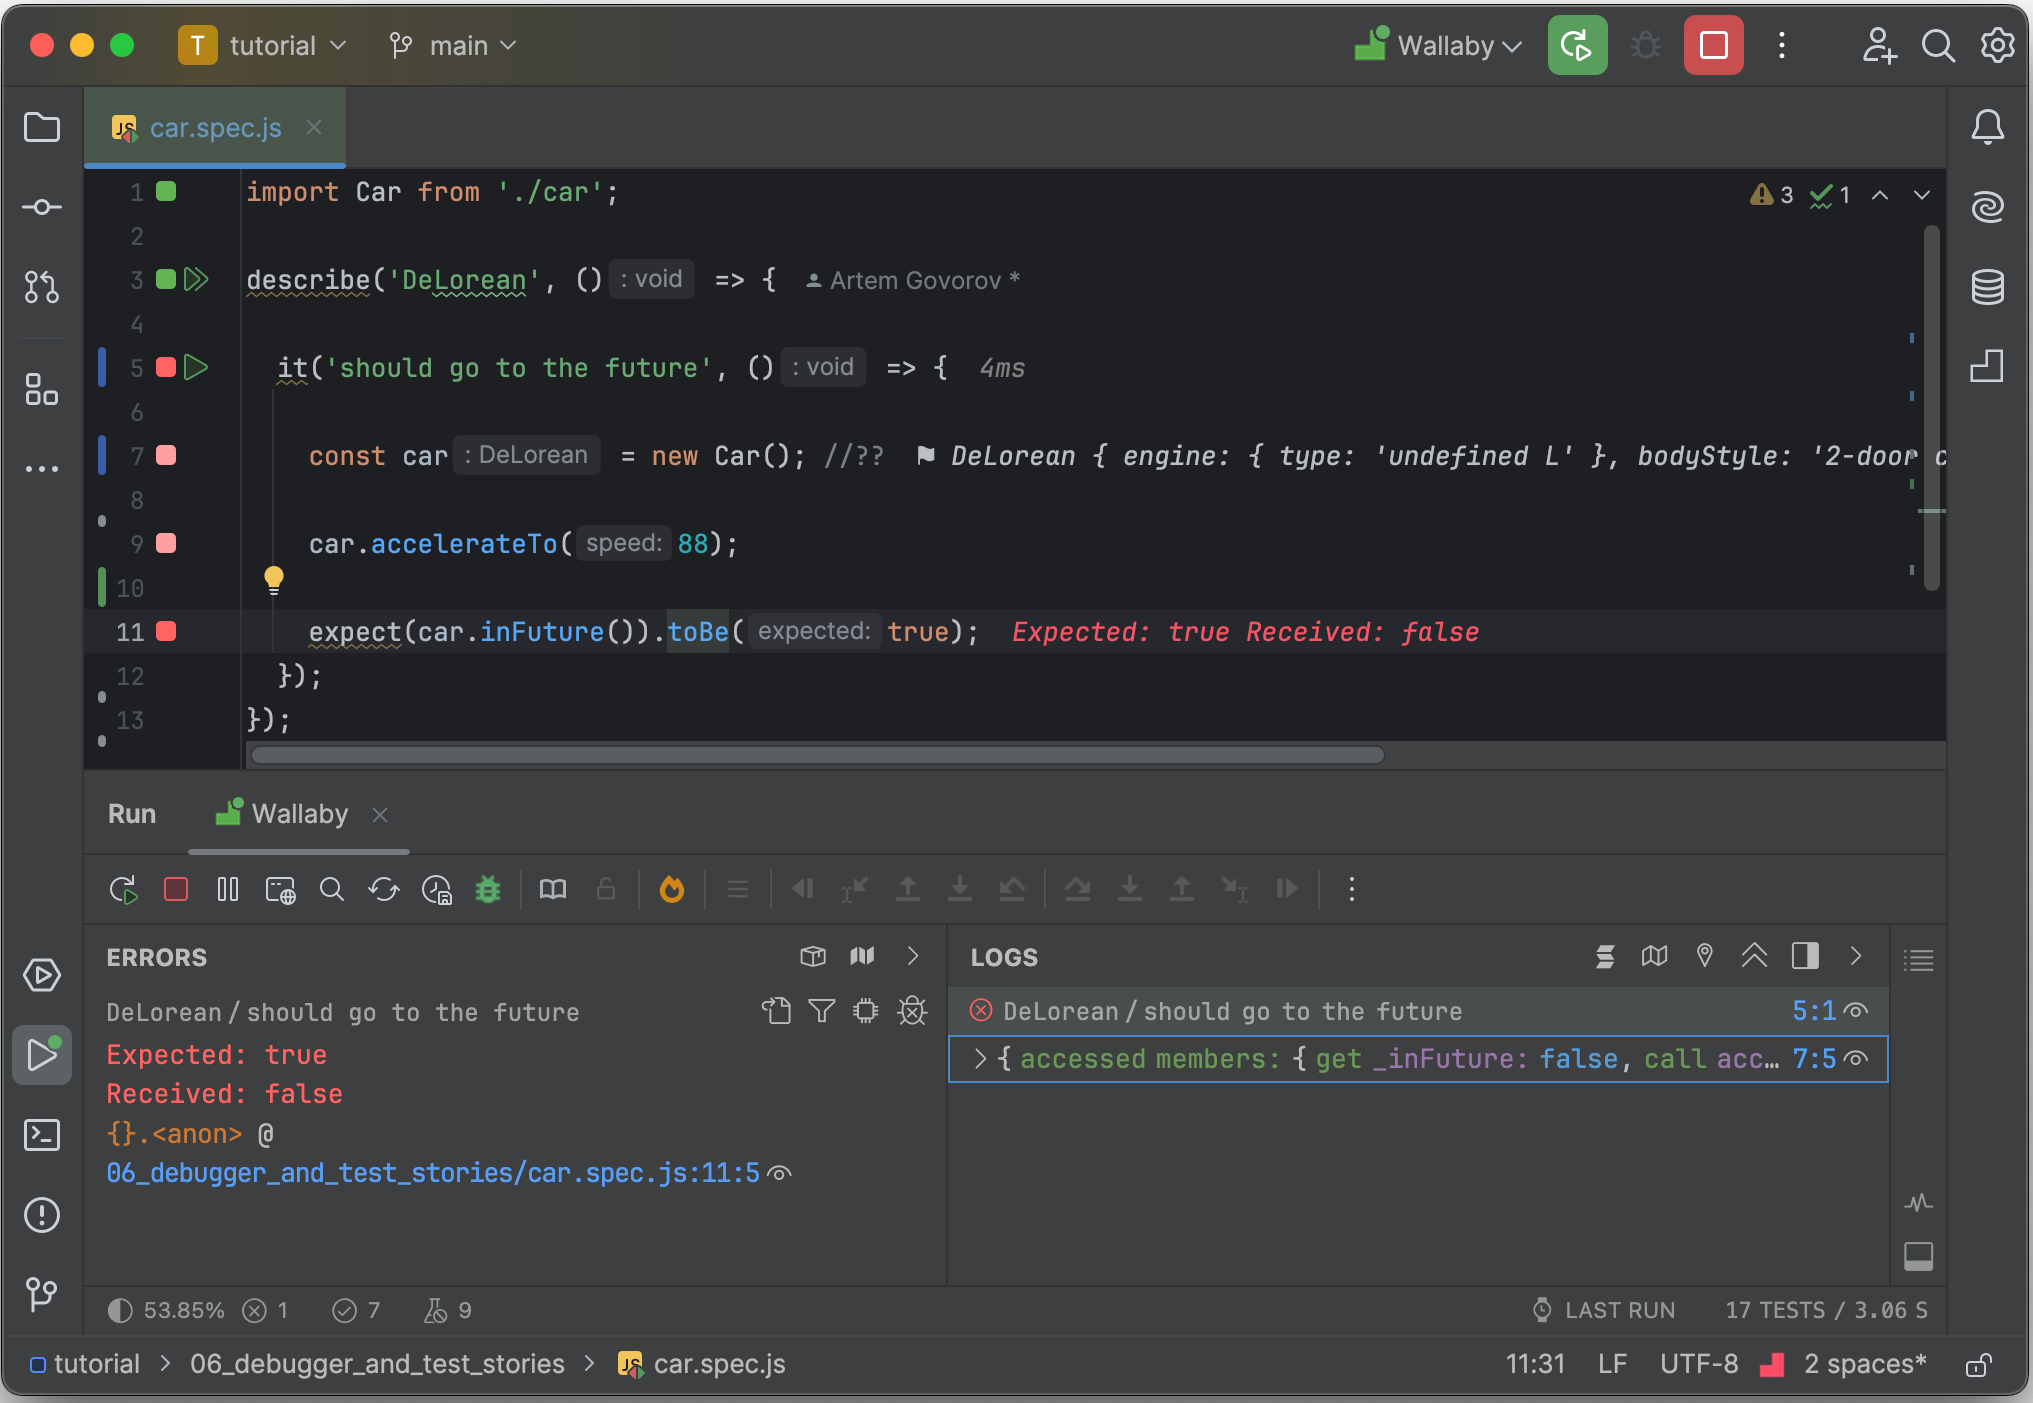
If you are quite familiar with the test and the source code that may be causing the error, you may be able to quickly identify the issue from the inline error message and navigate straight to the error or navigate from the error path to the failing test.
Overview Errors Panel
Wallaby Overview Errors Panel make it easy to explore values directly from the editor context, simplifying the process of diagnosing and fixing issues as they occur.
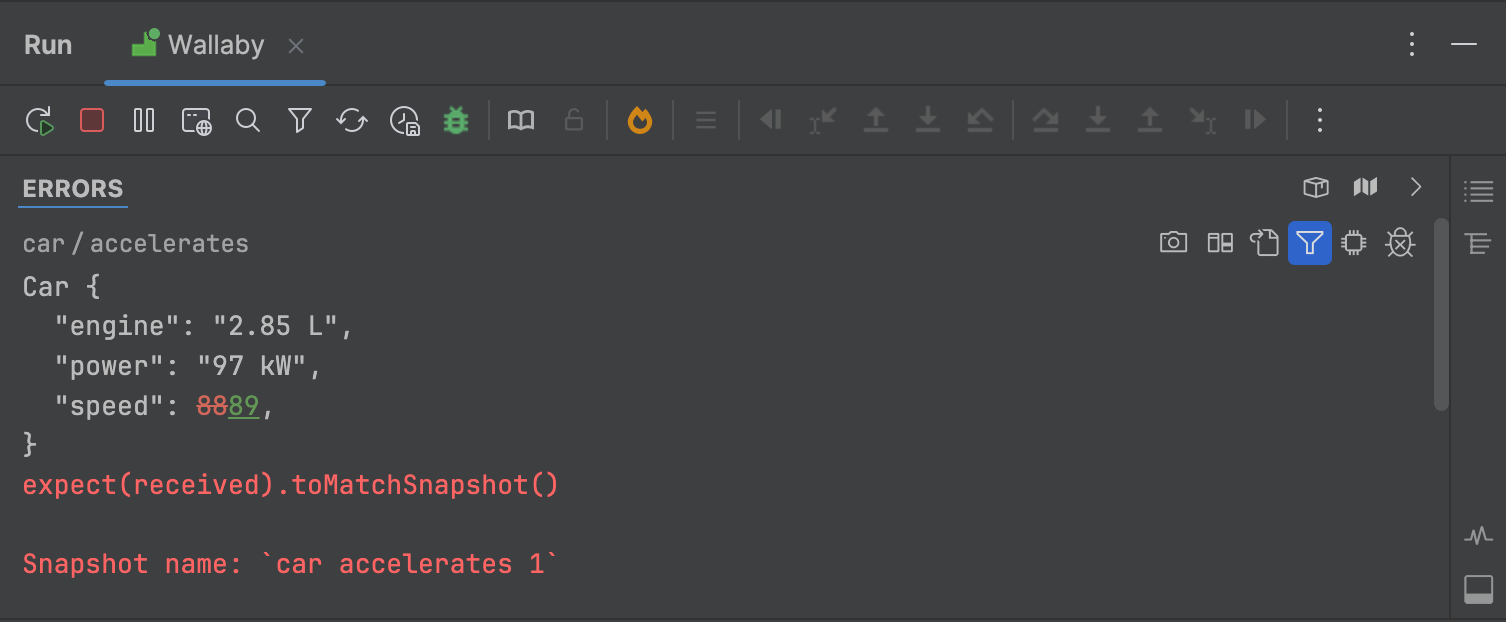
The panel provides actions to navigate through error-related code, debug and profile failing tests, view diffs and stack traces, all while previewing the related code.
The Explore error action and intention action allows you to quickly locate the error details in the error panel.
Inspecting Runtime Values
When using Wallaby as we write our tests and code, viewing runtime values of various variables and expressions becomes a very common task. Whether you are used to adding console.log or debugger breakpoints, Wallaby adds superpowers to your preferred approach and provides a few powerful tools to quickly view, inspect, and analyse runtime values.
console.log
As with runtime errors, console.log results are displayed inline, and if you simply move your mouse over the line with displayed inline value, you will see the extended output (if it doesn’t fit inline).
Identifier expression
In addition to console.log, you may use identifier expressions (i.e. just typing a variable name) to log any values.
Note that when using identifier expressions for logging (for example, typing a to see the value of the a variable), you may hit some limits in terms of the number of displayed properties and the logged object traversal depth. In this case, you may use console.log to display objects without the limitations.
Logpoints
The quickest way to log a value is to use Logpoints. Logpoints allow editor breakpoints to be used to display the value of any expression. They can be quickly added and removed using shortcut keys (F9 for line logpoints, and ⇧ F9 for inline breakpoints).
Logpoints can also be added to class or function declarations to log all lines within them.
Special comment
Another powerful way to log any expression is to use a special comment right after the expression you want to log.
Inserting the special comment //? (or /*?*/) after some expression will log just the value of that expression.
You may also write any JavaScript code right in the comment to shape the output. The code has the access to a variable, $, which is the expression that the comment is appended to. The executed code is within a closure, so it also has access to any objects that you may access from within the current lexical environment.
Unlike console logging, the other methods of logging described here have some built-in smarts. For example, when you place the comment after an expression that is a promise, the resolved value of the promise is logged. Or, if an expression is an observable, then its values are displayed.
Explore value action
When logged value is a complex object, you may use the Explore Value action to inspect the object in a more detailed way.
The Overview Logs panel provides real-time code logs, ensuring you never lose context. It features indentation guides and unlimited expand/collapse for easier navigation of nested objects. By combining the best of tree and text representation, logs are more readable, with each entry including contextual information to help you quickly trace its origin.
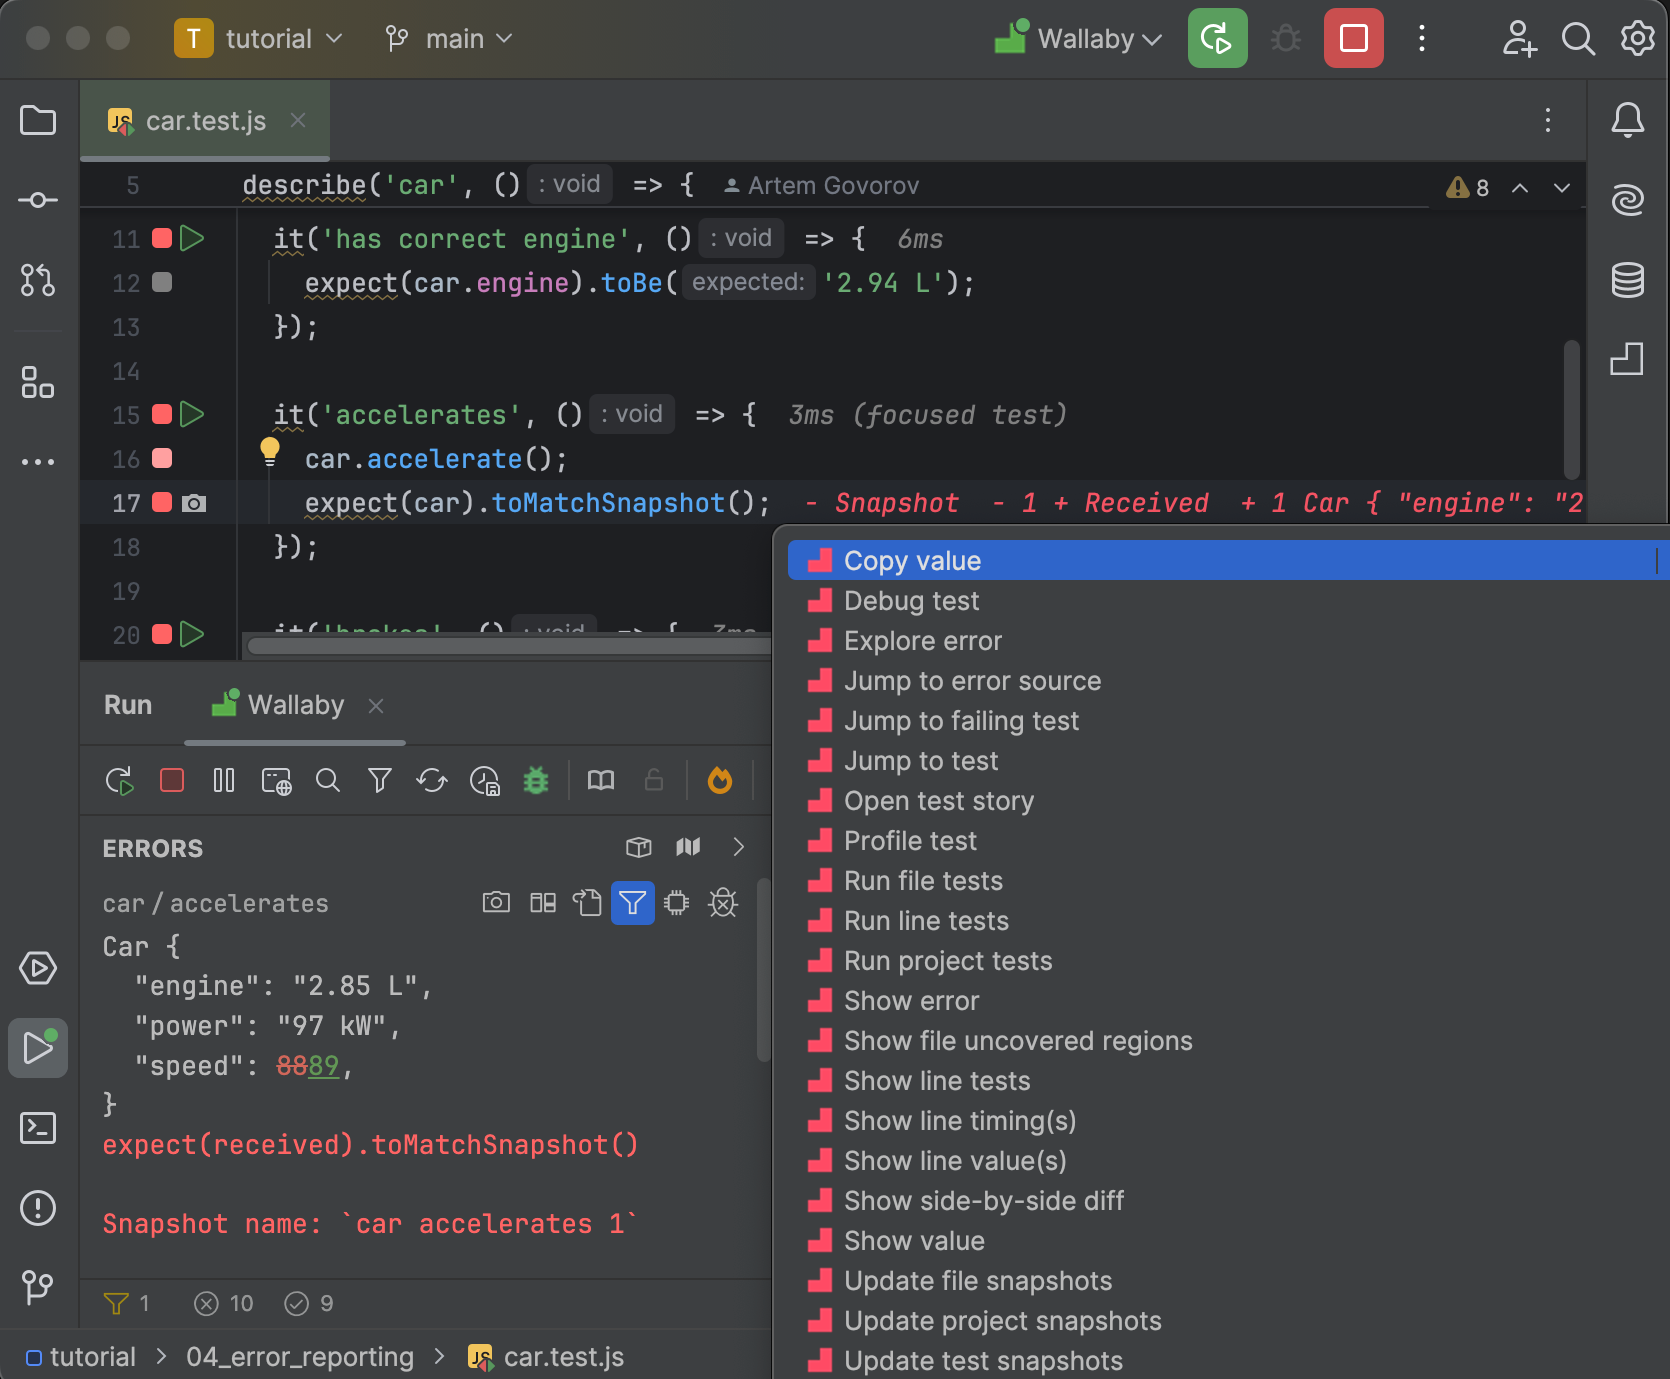
Show/Copy value action
In addition to special comments and logpoints, Wallaby provides two actions that allow you to quickly get the value of an expression without changing your code: Show Value and Copy Value commands.
If you want to output the values of multiple lines, you can use the Show Line Value(s) command. This command will output the same as Show Value for the selected line(s) as if you had selected the entire line to display.
Debugging
Being able to debug your tests is a crucial part of a modern development workflow. While a classical debugger can be helpful (and you can use it with Wallaby), it has not been designed to support a fast edit-and-continue test feedback loop.
Time Travel Debugger
Wallaby’s time-travel debugger provides a turn-key ergonomic debug experience that unlike a general purpose debugger was built from the ground up for debugging tests.
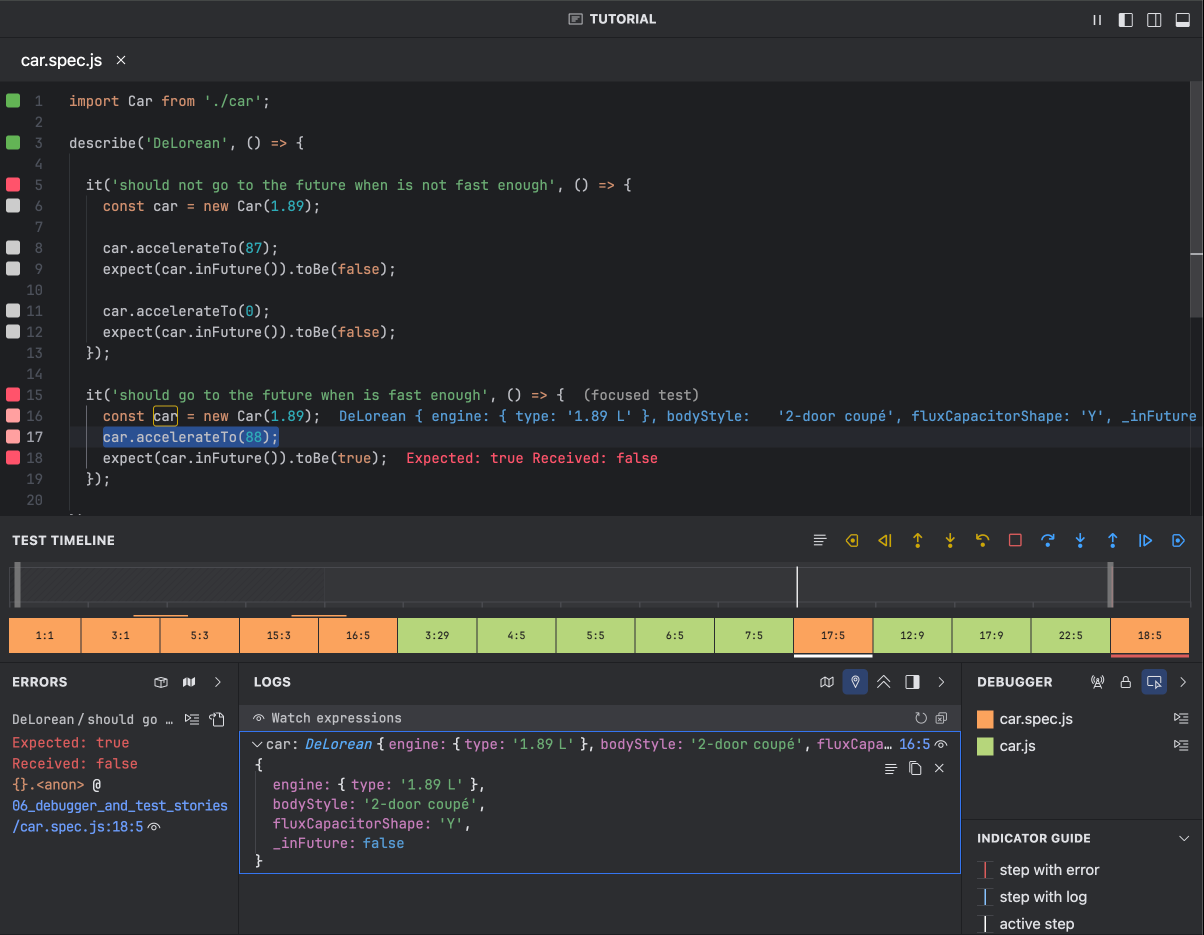
The debugger timeline offers a zoomable view of test execution, helping you quickly identify key stages like setup, imports, execution, and cleanup. It shows transitions between files, functions, and lines, highlighting markers, logs, and errors with their locations, along with past and future hits for the current line - giving valuable context for debugging.
Wallaby’s time-travel debugger can be started from any line of code with a single click, there are no special steps to perform to start using it, even breakpoints are optional. You can step forward and backward through your code to understand the conditions that led to a failing test.
Debug Actions are available from from the Debugger file actions and Debugger View header, as well as via keyboard shortcuts.
You can explore values while debugging using watch expressions. Simply hover over a variable or expression in your code to add it to the watch list. You can view the value directly from the hover or in the logs viewer. The watch expressions are persistent, auto-updated, and can be re-evaluated at any time if needed.
Test Stories
While it is useful to be able to quickly start the debugger and explore certain parts of the executed code, sometimes you may not know where to start with, and just want to see everything that the test is doing, without having to open and jump between lots of different source files.
Wallaby’s Test Story Viewer provides a unique and highly efficient way of debugging your code and inspecting what code your test is executing in a single logical view.
Click the View Story code lens above the test name to open Wallaby Test Story viewer beside your code. You may also use the Open Test Story Beside command to do the same.
Test Profiler
To analyze your tests’ runtime performance, you may use Wallaby Test Profiler. Wallaby Test Profiler allows you to quickly record a test’s CPU usage profile and inspect it using flame chart and top-down/bottom-up views.
Test Focusing and Filtering
Smart Start
Wallaby’s Smart Start feature allows you to quickly start Wallaby and only the test file(s) that you are currently working on will be executed. As soon as you open another test file, Wallaby will automatically run those tests and Wallaby will continue to execute those tests when they are affected by your code changes. Smart Start can be configured to always run a set of test files on start, and you can customize the automatic test execution behavior to run on edit (instead of open), or to never run automatically.
Using Smart Start is usually many times faster than running all tests within your project. For larger projects and times when you are working on a specific component within your project, this feature enables a highly productive workflow.
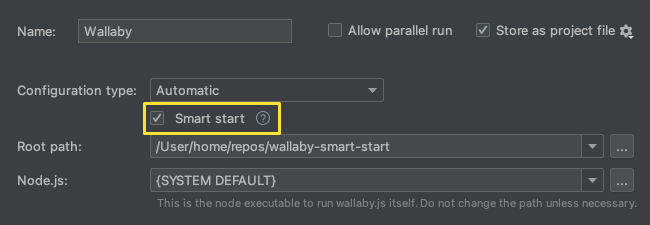
To start Wallaby with Smart Start in JetBrains editors, you will need to edit (or create a new) Wallaby.js Run Configuration by selecting Edit configurations from the drop-down menu in the top right-hand corner of the
navigation bar, or from the Run menu.
In the Run Configuration editor set the Smart start checkbox.
Test focusing
Sometimes when writing or debugging a test, set of tests or test file for a particular feature, you may want to only execute the specific test, set of tests or test file and see code coverage output only for the specified scope. Wallaby fully supports testing frameworks test focusing functions such as it.only, as well as special comments to focus/skip specific test files.
Wallaby also allows you to start for a selected file or folder using the Exclusive Test Run feature. If you have a large test suite which takes long time to run you may use the Start Exclusive Test Run command/menu item, which allows you to select a test file or a folder which contains the tests files you would like to focus on and start Wallaby and only run those tests. If you have already started an exclusive test run and would like to focus on additional tests files (or a folder) then you may use the Add to Exclusive Test Run command/menu item.
Test filtering
Test Filtering allows you to limit the display of coverage indicators, console messages, live comment messages and errors messages to only the tests that you are working on instead of all tests in your project.
Side View
While the Overview panel focuses on short-term testing tasks, the Side View is dedicated to strategic operations, offering a real-time overview of all tests, coverage, logs, status, and more.
You may open the Side View by using the Side View Wallaby Tool Window icon (the default location is the right side toolbar).
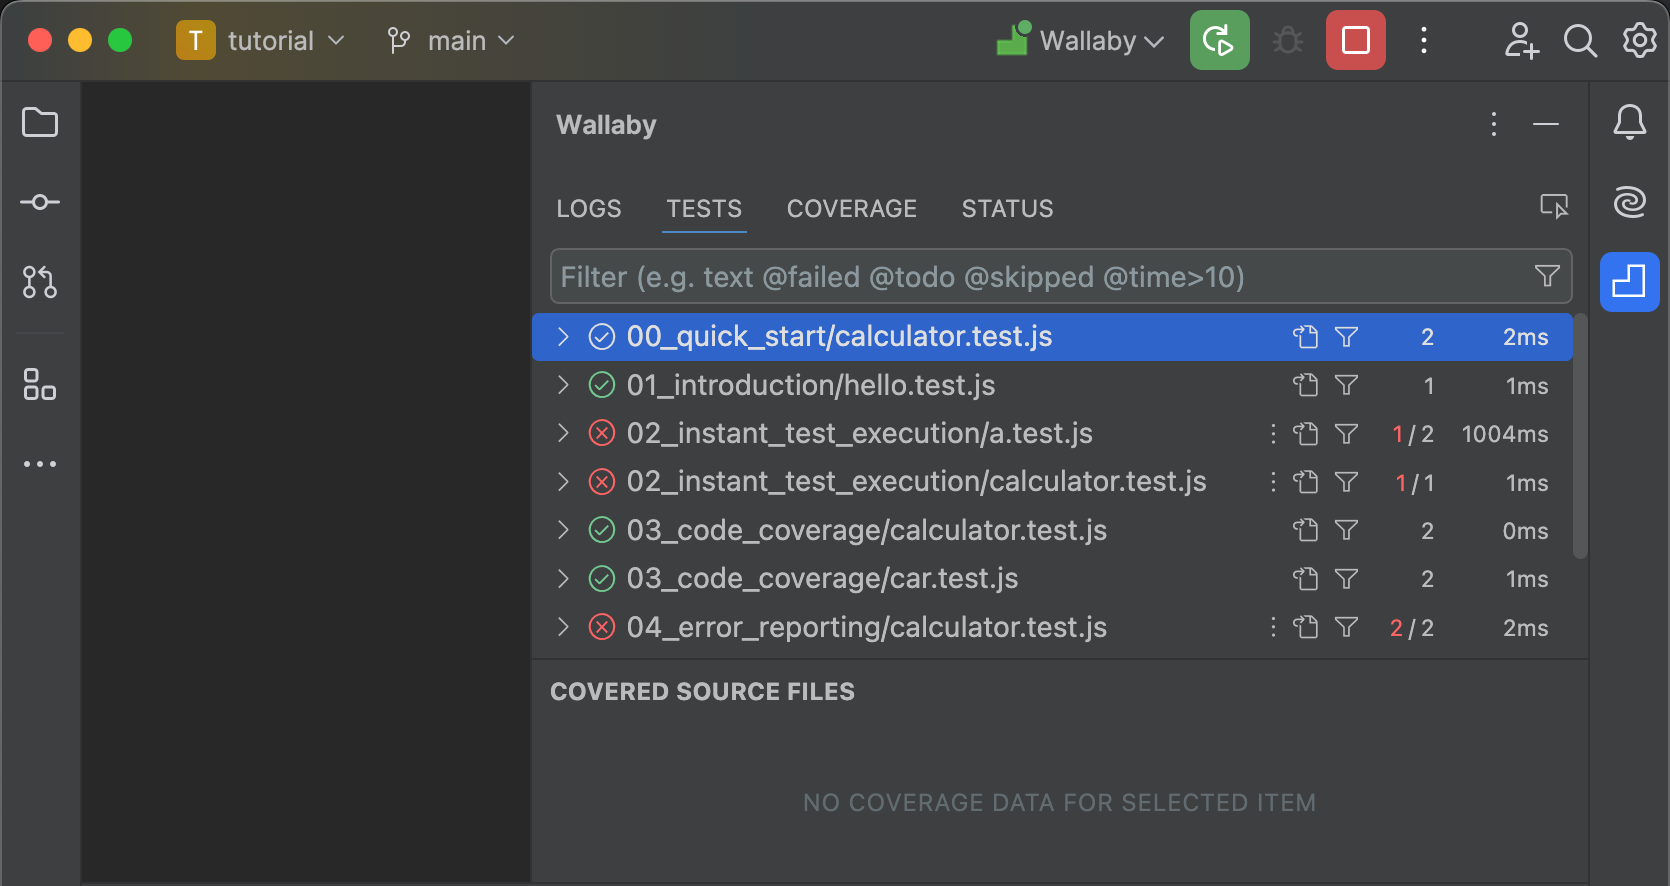
Tests
The Tests tab offers a test-centric overview and analytics for your project. The test tree displays all your tests in real time, with filters to focus on failing tests, long-running tests, or tests marked as “todo” or skipped. The selected test or file also shows the source files covered by the test, including test coverage metrics.
Coverage
The Coverage tab provides a file-centric overview and analytics for your project. It combines an annotated project file tree with a sortable list of files in selected folders/modules. This allows you to browse the tree structure, see aggregated coverage values, and easily identify the least-covered files, regardless of folder depth. You can also select individual files to view their code coverage.
Logs
The Logs tab is similar to the overview panel logs but designed for larger logs or more log entries. You can open it from the overview panel when you need more vertical space to explore and focus on specific log entries.
Status
The Status tab helps you quickly assess the current execution status and troubleshoot issues. For instance, if a test is taking too long, you can easily identify it and take necessary actions to address the problem.
Context actions
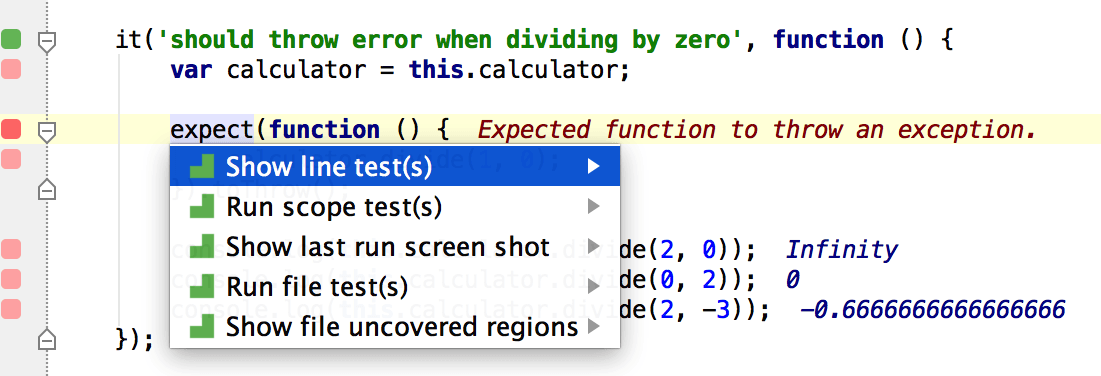
- Show line test(s): works similar to clicking a source code line square and displays the line related test data.
- Jump to failing test: quickly navigate to the failing test from any ‘pink’ context (the failing test execution path).
- Jump to error source: quickly navigate to the source of the test error from any ‘pink’ context (failing test execution path).
- Show line uncovered regions: this action is useful for “yellow” lines to display what exactly is not covered in the line. Not covered expressions will be highlighted in red.
- Show assertion data diff: displays the difference between the actual and expected data of the failed assertion (normally an equality one).
- Show file uncovered regions: similar to the previous action, this displays uncovered regions for the whole file. The red highlights for both actions can be removed by pressing Esc (or you can just start changing the file code and they will disappear).
- Run line test(s): the action is pretty simple (yet so wanted by so many) – it just runs a single test (if invoked from within the test) or all related tests (if invoked within some source code covered by the tests).
- Run file test(s): the action runs all tests within the test file it is invoked in, or all tests in all the test files that cover the source file that the action is invoked within.
- Run project tests: the action runs all tests in your project.
- Update project snapshots: the command updates all Jest snapshots in your project.
- Update file snapshots: the command updates all Jest snapshots in the current (focused) file, or all snapshots in all the test files that cover the source file that the action is invoked within.
- Update test snapshots: the command updates snapshots of a single test (if invoked from within the test) or all snapshots in all related tests (if invoked within some source code covered by the tests).
- Add test to filter: adds a test to the test filter. The action is available only when editor cursor is on a test declaration line and the test is not added to the filter yet.
- Remove test from filter: removes a test from the test filter. The action is available only when editor cursor is on a test declaration line and the test is already added to the filter yet.
- Clear value: clears Live Values on a line that were displayed by using Show Value action (press
Escto execute the action). - Clear file values: clears all Live Values in a file that were displayed by using Show Value action (press
Esc Escto execute the action). - Show last run screen shot: the command displays the screen shot for the last run test (Important note: this feature is only available when running your tests using Chrome and PhantomJs).
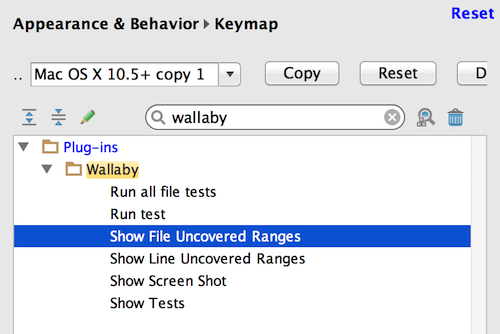
All of the described actions can also be mapped to any keyboard shortcuts you prefer for extra productivity. You can do so in Settings - Keymap (search for wallaby in the keymap settings).
The recommended workflow is just to keep Wallaby up and running as you edit your code. It should pick up existing file changes, file deletion, adding new files and tests (as long as they are listed in files patterns in the configuration file). Wallaby does its best to track the dependencies between your files and tests, but occasionally you may need to restart it if your changes are not picked up. You can stop/start Wallaby any time by stopping/starting the active run configuration.
Linked Mode
Wallaby Linked Mode allows you to use Wallaby’s new UI in a separate browser window, connected to your editor. It offers a seamless experience with easy navigation between the editor and Wallaby UI. The UI theme matches your editor’s, ensuring a consistent look and feel.
To open Wallaby Linked Mode, after starting Wallaby click the Open Wallaby in Browser icon at the top of your Wallaby Run Configuration output.
The Linked Mode also includes a code viewer that allows you to choose between viewing code in your editor or directly in Wallaby UI. This feature provides a convenient way to pick the best view for your current task, ensuring you have the flexibility you need to work efficiently.
Keyboard Shortcuts
Wallaby provides quick access to keyboard shortcuts documentation in both the Overview and Side view panels. Simply press the ? key while focused on either panel to display a comprehensive list of available shortcuts. This feature helps you navigate and interact with Wallaby’s interface more efficiently, making it easier to access various functionalities without reaching for the mouse. The shortcuts help overlay remains visible until you press Escape to dismiss it, allowing you to learn and reference the shortcuts at your own pace.
Known Limitations with Remote Development / Dev Containers
Wallaby does not currently support using JetBrains editors with Remote Development or Dev Containers due to limitations in the JetBrains plugin feature set. We are tracking this limitation and will update our documentation if support becomes available in the future.
For now, we recommend using Wallaby in standalone mode if you are using Remote Development or Dev Containers. If you’re running Wallaby Standalone inside a container, you may need to map the port to make Wallaby available on your main operating system.