First you need to install wallaby.js plugin for your IDE, if you haven’t done it yet.
This tutorial demonstrates how to use wallaby.js in WebStorm, IntelliJ IDEA, Rider, PhpStorm, RubyMine, or PyCharm. You may also find a sample calculator project with created run configurations and config files for Mocha, QUnit and Jasmine in this repository.
Configuring Wallaby
Wallaby for JetBrains IDEs needs to know what configuration is required to run your tests.
To configure Wallaby, create a new Wallaby.js Run Configuration by selecting Edit configurations from the drop-down menu
in the top right-hand corner of the navigation bar, or from the Run menu.
If you are using a technology that is supported by automatic configuration, then
set your run configuration’s Configuration Type value to Automatic. If you have a mono-repo and only want to run
for one project then set the Root Path to your project folder.
If your project does not support automatic configuration then you will first need to create a configuration file
in your project’s root and select this as your Configuration File in your run configuration. You can read more about the configuration
file format and other settings in the configuration file section.
Starting Wallaby
Once you have created and saved the run configuration, you can start Wallaby by running your run configuration. The first time you start, Wallaby may take a minute or two to install its dependencies. The dependencies are cached and updated automatically when required.
Once you have started the run configuration, in the bottom right-hand corner of the screen you’ll see the wallaby status indicator. Its job is pretty simple: when it displays a spinner, your tests are running; when it’s red, you have some failing tests; when it’s green, all of your tests are passing.
Tool window
When wallaby.js starts, it also displays a tool window. While writing code, you may not need the window to be opened, so you can collapse it. You can expand it any time by clicking the wallaby.js status indicator (or using the standard way to open a run configuration tool window).
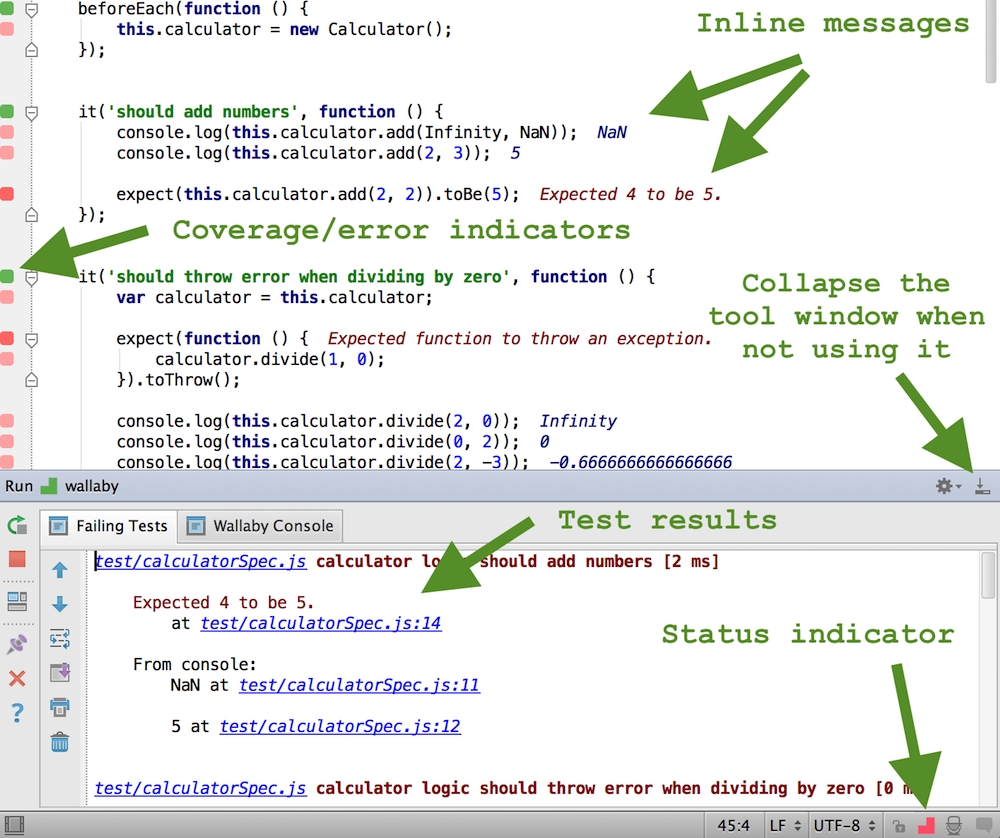
In the tool window you can see the Failing Tests tab and the Wallaby Console tab.
The Failing Tests tab displays all tests that are currently failing along with the error stacks and registered console.log calls. Some bits of the displayed information are hyperlinks that you can use with your mouse or keyboard to navigate to different places, for example to the exact error line, or a failing test, or a place where something is logged to console.
Also, when a test error contains expected and actual properties, the Failing Tests tab displays compact diff view and can display side-by-side diff view. This allows to quickly debug failing equality assertions and snapshots.
The Wallaby Console tab also displays some additional information about test execution progress. The tab can also be useful for troubleshooting wallaby.js issues.
Code coverage
Once wallaby.js is running, you can see the code coverage in the source files that it tracks (specified in the configuration file). The coverage is live, so you can start changing your code and the coverage will automatically be updated, just as you type.
As you can see, there are various colored squares displayed for each line of your source code.
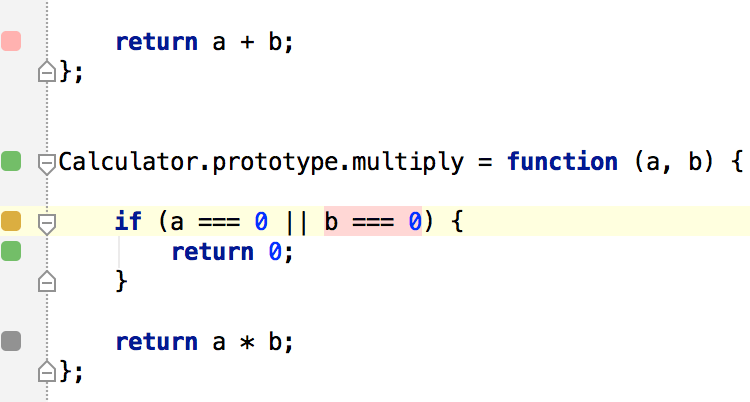
- Gray squares mean that the source line is not covered by any of your tests.
- Green squares mean that the source line is covered by at least one of your tests.
- Yellow squares mean that the source line is only partially covered by some of your tests.
- Red squares mean that the source line is the source of an error or failed expectation, or is in the stack of an error.
- Pink squares mean that the source line is on the execution path of a failing test.
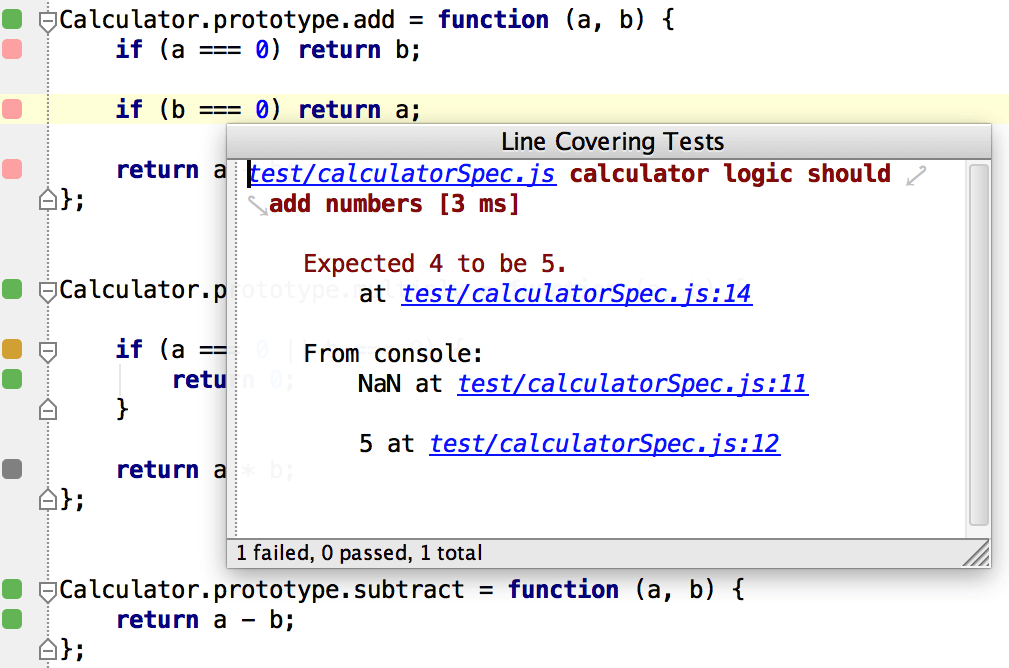
Clicking a square against a source code line will display a window with the information about the tests covering the line, including any error messages and console.log messages.
You can search inside the window by using standard Cmd/Ctrl + F command and navigate links by using Cmd/Ctrl + B.
Short error messages, expectation failures and console.log messages are also displayed inline, right where and when they happen. This is very convenient as it allows you to avoid context switching and fix the issues in place, as you write your code.
We also recommend reading about some more powerful ways to log things and measure code performance with wallaby.js.
Value Explorer
Value Explorer integrates with Wallaby’s existing variable and expression output mechanisms (logpoints, console.log, live comments, identifier expressions, and the Show Value command) to display values in an easy-to-navigate, real-time tree view. The tree can be expanded to any depth and can copy paths/values to the clipboard.
Time Travel Debugger
Wallaby’s Time Travel Debugger allows you to move forward and backwards through your code to understand the conditions that led to a specific bug. The Time Travel Debugger accelerates your edit, compile and debug loop by allowing you to jump to a specific line of code, view runtime values, edit-and-continue and step into, over and out of your code.
Test focusing
Sometimes when writing or debugging a test, set of tests or test file for a particular feature, you may need to execute this specific test, set of tests or test file and see code coverage and output only for the specified scope.
Wallaby fully supports testing frameworks test focusing functions such as it.only, as well as special comments to focus/skip specific test files.
Wallaby also allows you to start Wallaby for a selected file or folder using the Exclusive Test Run feature. If you have a large test suite which takes long time to run you may
use the Start Exclusive Test Run command/menu item that allows you to select a test file or a folder which contains the tests files you would like to focus on and start Wallaby only to run them. If you already have Wallaby started
but you would like to focus only on a specific test file or a folder then you may use Add to Exclusive Test Run command/menu item.
To reset the exclusive test run and run all you project tests you may use the Run Project Tests command.
Test filtering
Test Filtering allows you to limit the display of coverage indicators, console messages, live comment messages and errors messages to only the tests that you are working on instead of all tests in your project.
You may notice that Test Focusing covers filtering, but there are two key differences between them:
- The
Test Filteringin contrast to theTest Focusingdoes not re-execute your tests when applying/clearing the filter. When you change from only running selected test(s) to running all tests in your project, all tests are re-run; theTest Filteringdoes not re-run any tests when the filter is set or cleared. - The
Test Filteringfeature does not actually change Wallaby’s run-time behavior (after any code change, the minimum set of affected tests will be re-run). In contrast, theTest Focusingfeature may enable a more efficient workflow for large repositories with many test files, or for slower tests, as Wallaby will only process/run the selected tests.
Wallaby supports three ways of adding and removing tests and test files to/from the test filter:
Add test to filterandRemove test from filtercontext actions
Toggle Test Filteraction
- Wallaby App (with full editor synchronization)
You may clear the test filter by clicking on the Reset Test Filter button on the left hand side of your Wallaby Run Configuration window, by executing the Reset Test Filter action or by clicking on the Reset test filter button in Wallaby App.
Context actions
Another way to access some source code line/context actions is to use the light bulb quick actions, or just press Alt + Enter on any line. The actions that you can use include:
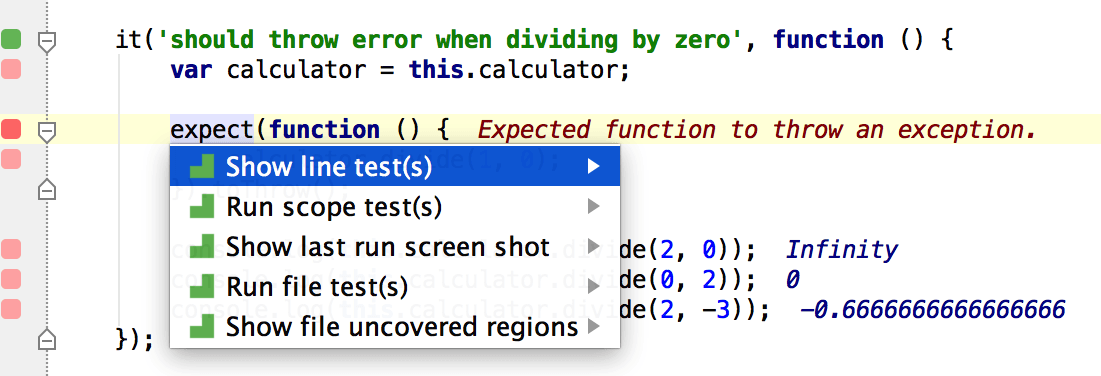
- Show line test(s): works similar to clicking a source code line square and displays the line related test data.
- Jump to failing test: quickly navigate to the failing test from any ‘pink’ context (the failing test execution path).
- Jump to error source: quickly navigate to the source of the test error from any ‘pink’ context (failing test execution path).
- Show line uncovered regions: this action is useful for “yellow” lines to display what exactly is not covered in the line. Not covered expressions will be highlighted in red.
- Show assertion data diff: displays the difference between the actual and expected data of the failed assertion (normally an equality one).
- Show file uncovered regions: similar to the previous action, this displays uncovered regions for the whole file. The red highlights for both actions can be removed by pressing Esc (or you can just start changing the file code and they will disappear).
- Run line test(s): the action is pretty simple (yet so wanted by so many) – it just runs a single test (if invoked from within the test) or all related tests (if invoked within some source code covered by the tests).
- Run file test(s): the action runs all tests within the test file it is invoked in, or all tests in all the test files that cover the source file that the action is invoked within.
- Run project tests: the action runs all tests in your project.
- Update project snapshots: the command updates all Jest snapshots in your project.
- Update file snapshots: the command updates all Jest snapshots in the current (focused) file, or all snapshots in all the test files that cover the source file that the action is invoked within.
- Update test snapshots: the command updates snapshots of a single test (if invoked from within the test) or all snapshots in all related tests (if invoked within some source code covered by the tests).
- Add test to filter: adds a test to the test filter. The action is available only when editor cursor is on a test declaration line and the test is not added to the filter yet.
- Remove test from filter: removes a test from the test filter. The action is available only when editor cursor is on a test declaration line and the test is already added to the filter yet.
- Clear value: clears Live Values on a line that were displayed by using Show Value action (press
Escto execute the action). - Clear file values: clears all Live Values in a file that were displayed by using Show Value action (press
Esc Escto execute the action). - Show last run screen shot: the command displays the screen shot for the last run test (Important note: this feature is only available when running your tests using Chrome and PhantomJs).
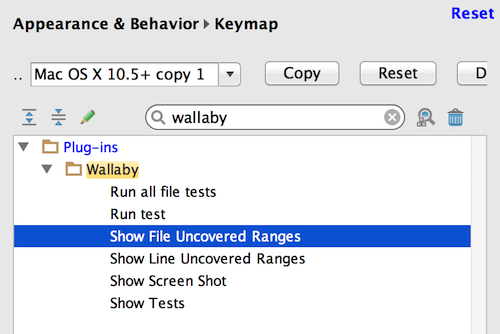
All of the described actions can also be mapped to any keyboard shortcuts you prefer for extra productivity. You can do so in Settings - Keymap (search for wallaby in the keymap settings).
The recommended workflow is just to keep wallaby.js up and running as you edit your code. It should pick up existing file changes, file deletion, adding new files and tests (as long as they are listed in files patterns in the configuration file). Wallaby.js does its best to track the dependencies between your files and tests, but occasionally you may need to restart it if your changes are not picked up. You can stop/start wallaby.js any time by stopping/starting the active run configuration.
Search tests
To search and quickly navigate to a test you may use the Search Tests button that is available on the left hand side of your Wallaby Run Configuration window:
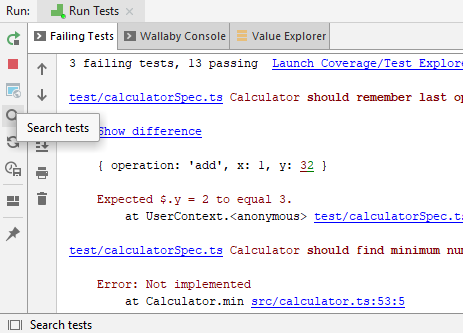
Clicking the button runs Jump to Test action that allows to quickly search across all your tests and navigate to the selected test:
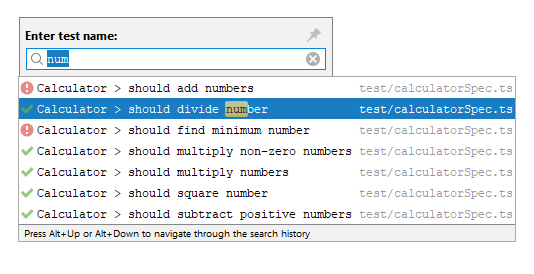
The action can also be mapped to any keyboard shortcut you prefer.
Pause/Resume
In some scenarios you may want to pause real-time tests execution for instance if you’re working on a really slow test which has side effects, or you simply don’t need to get real-time feedback at this moment in time. In those cases may pause Wallaby and resume it whenever you need it again.
When resuming, only the tests which were affected by your changes while Wallaby was paused will be executed.
Run only on Save
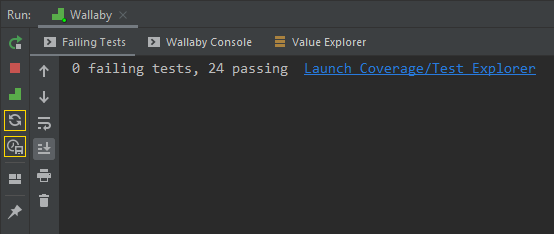
If you would like to only run your tests when your files are saved to disk, you may update the run mode for your Wallaby session. Two commands are available on the left hand side of your Wallaby Run Configuration window (highlighted in the screenshot below):
- Make current session Run on any change: the command makes your current Wallaby session start a test run when code is changed in your editor or when code is saved on disk.
- Make current session Run only on save: the command makes your current Wallaby session start a test run ONLY when code is saved on disk.
Important Note: to use the Run only on Save feature, you must first disable auto-save:
- Go to File > Settings (Ctrl+Alt+S).
- Go to Appearance & Behavior > System Settings.
- Make sure the two are unchecked:
- Save files on frame deactivation
- Save files automatically if application is idle for x sec.
- Make sure the two are unchecked:
- Go to Editor > General > Editor Tabs
- Put a checkmark on “Mark modified files with asterisk”
- (Optional but recommended) Under “Tab Closing Policy”, select “Close non-modified files first”. You may also want to increase the number of allowed tabs.
- Click Apply > OK.
- Go to Appearance & Behavior > System Settings.
Wallaby Colors
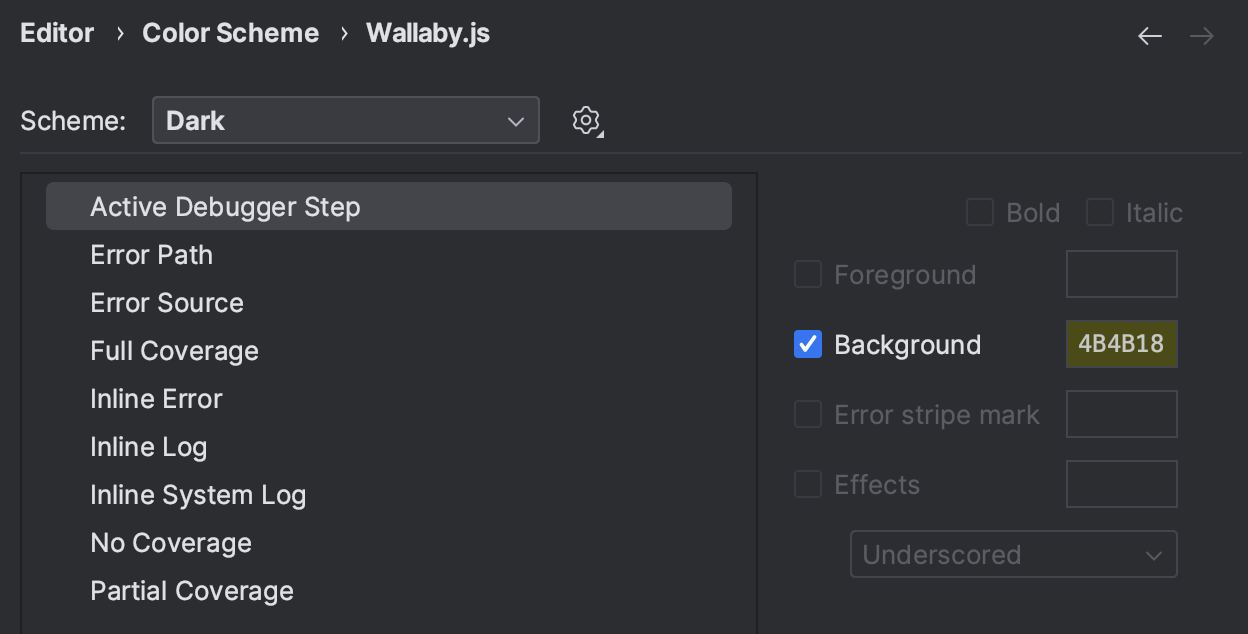
If some Wallaby.js default colors don’t fit your theme, they may be adjusted from your editor settings, Editor | Color Scheme | Wallaby.js.
Windows Subsystem for Linux (WSL)
For Microsoft Windows environments, Wallaby may be configured to run using WSL. Both WSL1 and WSL2 are supported by Wallaby within JetBrains editors.
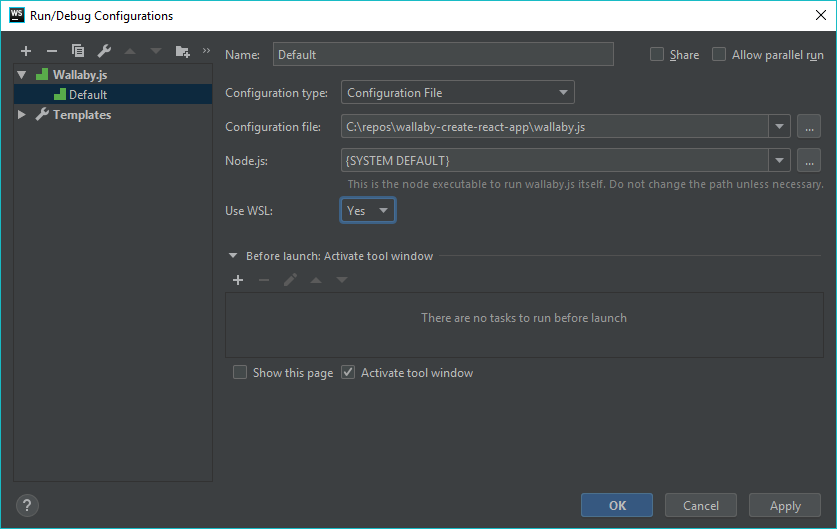
If you are a Windows user wanting to run your Wallaby tests using WSL, you may specify to Use WSL in your Wallaby Run Configuration.
Depending on how node is installed in your WSL instance, you may also need to explicitly provide the path to node in the Node.js setting of your Wallaby Run Configuration.
When using WSL, the path should reflect the path on your WSL environment, not your Windows environment.
If you are using chrome (headless), by default Wallaby will use your Windows installation of Chrome. You may need to update your Windows Firewall rules in order for your tests to be able to run, the following Powershell command executed with administrator privileges allows the WSL2 distributions connect to your Windows environment:
New-NetFirewallRule -DisplayName "WSL" -Direction Inbound -InterfaceAlias "vEthernet (WSL (Hyper-V firewall))" -Action Allow
The InterfaceAlias argument might vary based on your network configuration and your WSL/Window version.
On older versions of Windows, the InterfaceAlias could be vEthernet (WSL). You can find the correct value by running the Get-NetAdapter -IncludeHidden command in Powershell.
The other way to enable connectivity between the host and the WSL2 distribution is to exclude the vEthernet (WSL) network from your list of
public protected network connections in your Windows Defender Firewall settings.
If you would like to use a version of Chrome installed in your WSL2 environment, then you must specify the path to the Chrome executable in your Wallaby configuration, for example:
module.exports = {
  ...
  env: {
    runner: 'google-chrome'
  }
}
```
Trial version
Wallaby is installed with a limited-time feature-complete demo license that periodically prompts you to restart your editor to continue using the tool. Free Trial licenses that allow you to evaluate without prompts and restarts are also available.