Imagine if detective stories were written like we write our code. Excited to find out who the murderer was, you open the book and start reading. However, after just a few lines, you need to open another book on a specific page, because the story continues there.
After a few more lines, you need to open yet another book at another page to keep reading, and again and again. A few minutes into the story and you have several opened pages in several different books.
Suddenly somebody in your room asks you something, and you spend a minute to answer, then turn your head back to your book and … where the hell was I? who is who? what happened before now?
The saddest thing is that the whole story (or its most interesting parts) may be presented in just a single “logical” easy-to-read page.
Files in our code editors are our books. We, programmers, use files because it is easier to write, modify, and compose our code this way. At the same time, when we think of an executed test, we want to read the code to understand the sequence of executed steps. Tests tell us stories, and files get in our way when we want to read test stories. Here at Wallaby we wanted to make reading test stories easier for everyone.
To view a test story in Wallaby for VS Code, you may simply run the Open Test Story command for any line of your code or test.
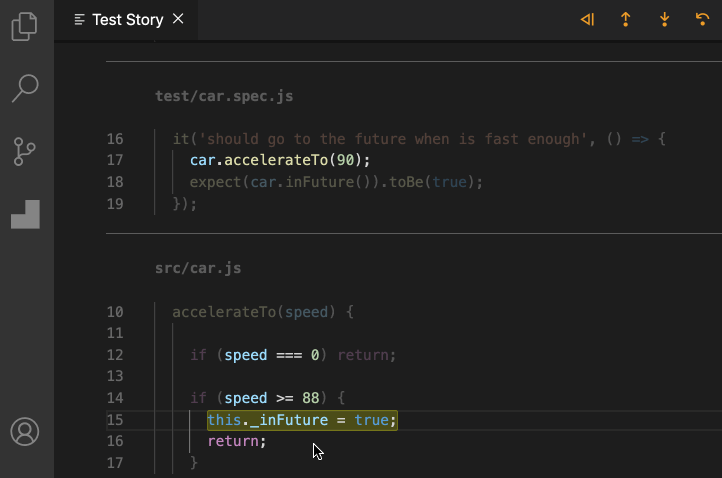
The opened view represents the full story of the selected test. Executed lines are highlighted and context lines are faded out. Whenever the execution jumps to a new file, the file name is displayed. When the execution jumps within the file, the “…” is displayed.
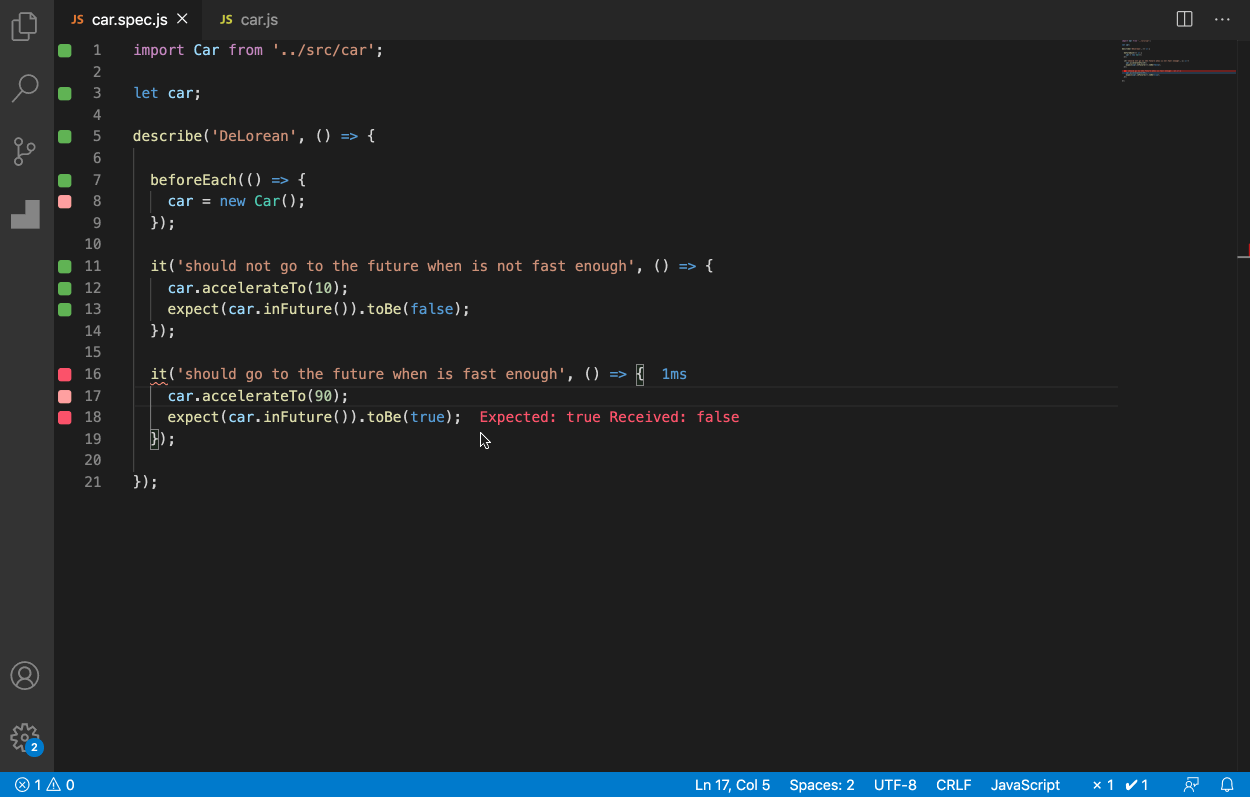
Initially, the line that you ran the command on will be highlighted, and you are free to scroll to the very end to see the test error, or to the beginning where test dependencies are imported, or search the view, find the place that interests you and start from there.
Wallaby Time Travel Debugger is also fully available when a Test Story is displayed. This means that you can:
- Step in/out/over back and forth, or run to a specific code line.
- Select any expression in the executed code to inspect its value.
At any time you may use VS Code’s built-in Go To Definition or Peek Definition commands to open or view the original source code.
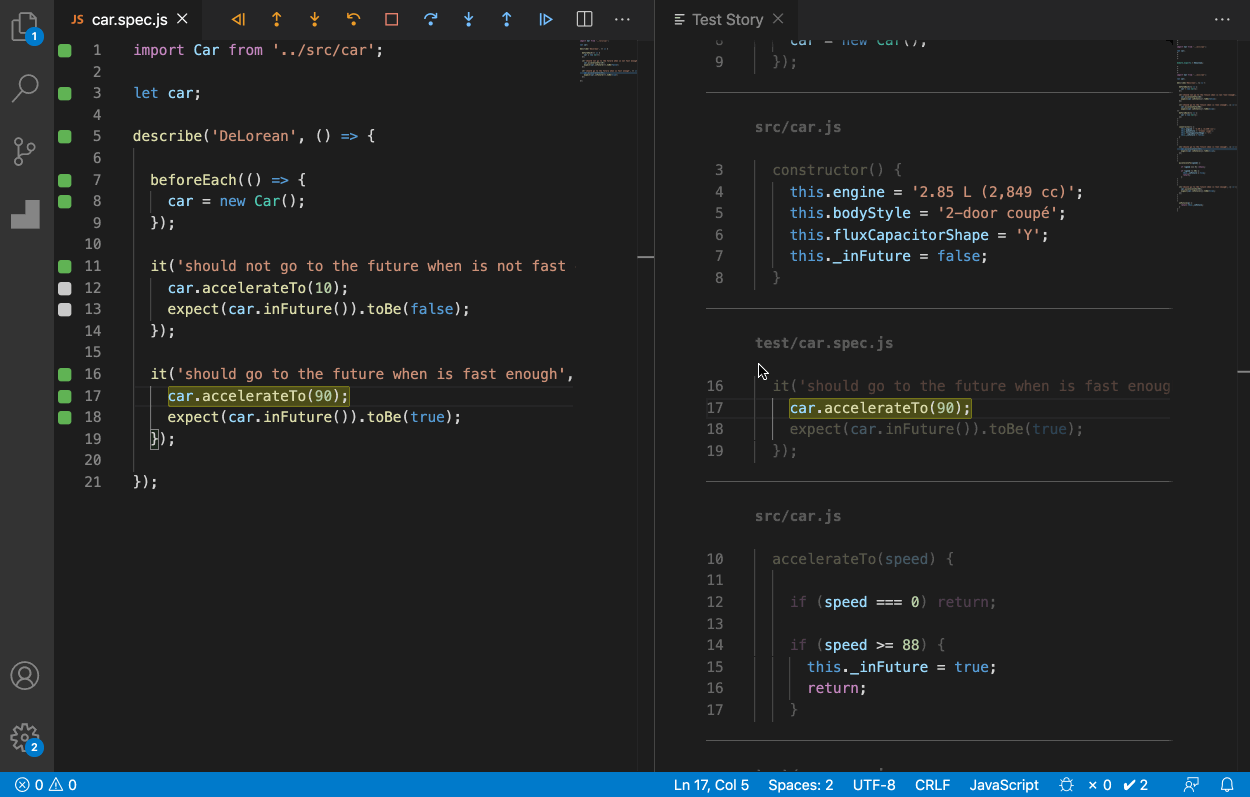
The Open Test Story Beside command opens the Test Story Viewer beside your active code editor. When this mode is used, any debugger navigation will be reflected both in the test story and in the original files.
We strongly believe that the new feature can change the way you debug your tests and make the process much simpler and faster.