Wallaby’s Time Travel Debugger allows you to move forward and backwards through your code to understand the conditions that led to a specific bug. With built-in support for edit-and-continue you don’t have to stop or even restart the debugger as you change your code. You can even leave the debugger on while working on new features.
One of our earliest feature requests for Wallaby.js was to provide debugger support. It took us a while to implement this feature because of the sheer complexity of the feature in the context of running tests; the world of JavaScript is so configurable and variable and Wallaby.js not only runs tests in parallel but actually modifies your code before your tests are executed. We also wanted to make sure that we provided a turn-key ergonomic debug experience that is ideal for debugging tests.
Internally, we’ve been using the time travel debugger within our team for a few weeks and it really accelerates your edit, compile and debug loop by allowing you to jump to a specific line of code, view run-time values, edit-and-continue and step into, over and out of your code.
Read on for more details about what the debugger experience is like…
Starting the Debugger
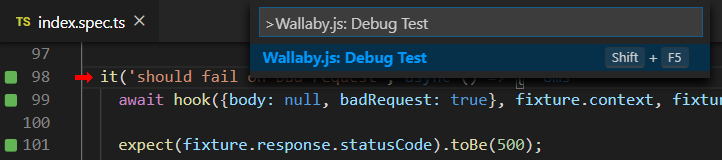
Starting the debugger is super easy, navigate to any line of your code that is covered by a test and run the Wallaby.js: Debug Test command. The debugger will start and automatically progress to the current line. If you start the debugger from a line of code that is covered by multiple tests, you will be prompted to select which test you want to debug.
Debugger View
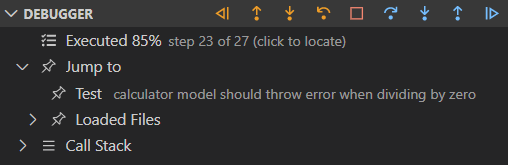
The Debugger View displays all information related to your debug session and provides the ability to quickly navigate to important parts of your project that were detected during the test run. Debug Actions are available from from the Debugger View header as well as via keyboard shortcuts, supporting the following commands: Run Back to Active Line, Step Back Out, Step Back Into, Step Back Over, Stop Debugger, Step Over, Step Into, Step Out, and Run to Active.
Inspecting Runtime Values
Inspecting runtime values during time-travel debug sessions is quick and easy. All you need to do is select the object, object property, parameter, expression or variable that you want to view. When you do this, Wallaby will display the value that you selected beside your code, and in Value Explorer.
Today, the feature is only available VS Code. Next month we will be adding support for JetBrains IDEs.