Wallaby v2
Wallaby.js has been a trusted testing tool for nearly a decade, helping developers make testing faster and smarter. While Wallaby v1 has served many of you well, we imagined a future where testing could be even more streamlined and innovative.
With Wallaby v2, our goal was to provide more power, flexibility, and a unified user experience across all editors. Inspired by our work on Console Ninja, we saw the potential to go beyond the limitations of editor extension APIs and deliver something truly innovative.
Wallaby v2 is the result — designed to streamline testing, introduce new features, and unlock improvements we’ve long envisioned. Today, we’re excited to share this new chapter and redefine your testing workflow.
What are the main features of Wallaby v2
Wallaby v2 introduces a range of improvements aimed at enhancing usability, streamlining workflows, and extending support for more editors:
- New UI and improved ergonomics: All panels and views have been redesigned for a cleaner, more efficient experience.
- Side Panel: A fully integrated UX that replaces the Wallaby App Test and Coverage explorer, bringing more functionality while seamlessly blending into supported editors like VS Code and JetBrains IDEs.
- Linked Mode: Use the new Wallaby UI in a separate browser window, connected to your editor (VS Code, JetBrains IDEs, Visual Studio, Sublime Text).
- Standalone Mode: Use Wallaby with any editor without an extension, including Neovim, Vim, Zed, Fleet, Emacs, and more, through a separate browser window. Just run
npm install -g @wallabyjs/cli && wallaby. - Interactive Time Travel Debugger: Now with an interactive timeline and persistent watch expressions to make debugging faster and more insightful.
- Advanced test execution progress monitoring: Get real-time, high-fidelity progress updates and time estimates for your tests.
Overview Panel
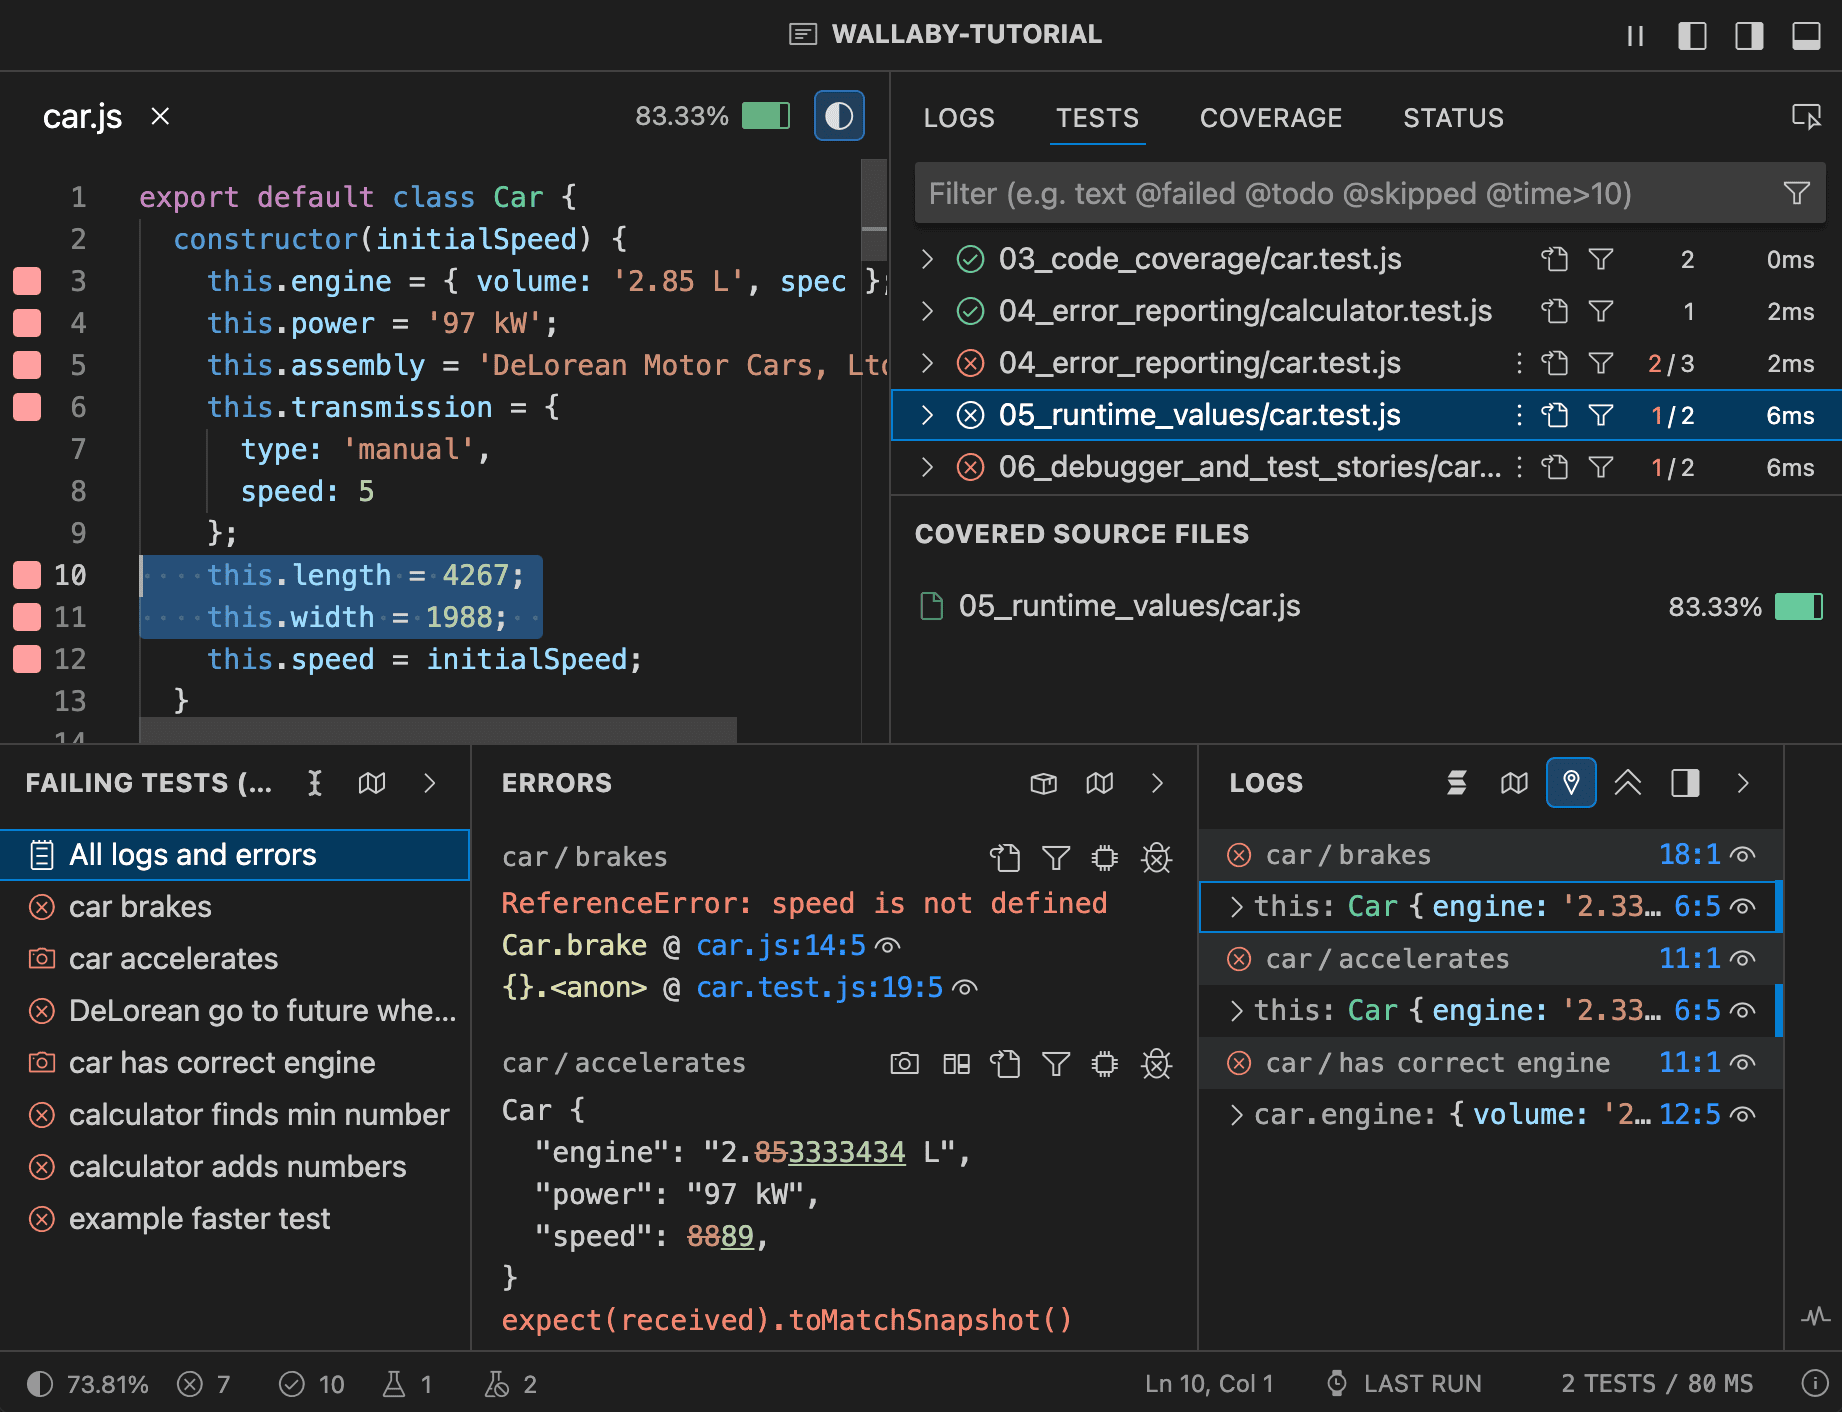
Wallaby v2 introduces a cohesive and integrated Overview panel, providing a centralized hub for all ongoing tactical testing activities, such as analyzing failing tests, exploring errors and logs, and debugging.
At startup, Wallaby’s Overview panel offers clear progress indicators and time estimates, giving you an immediate sense of what to expect. You can quickly assess the current status and troubleshoot any issues that arise, ensuring a smoother workflow.
Overview Tests focuses on the most important tests (failing, focused, or even tests covering a current/specific line of code), so you can concentrate on what truly matters without being overwhelmed by unnecessary details.
Overview Errors and Overview Logs make it easy to explore values directly from the editor context, simplifying the process of diagnosing and fixing issues as they occur.
Wallaby v2 provides actions to navigate through error-related code, debug and profile failing tests, view diffs and stack traces, all while previewing the related code. This comprehensive approach helps you quickly diagnose and resolve issues.
As you may know, Wallaby offers convenient ways to log values in real-time, ranging from adding console.log statements to effortlessly placing a logpoint with a single keystroke.
Wallaby v2 provides a comprehensive view of your code logs, updated in real time as you make changes to your code, ensuring you never lose context. It also features indentation guides and unlimited expand/collapse functionality for faster navigation through the nested structure of your objects. By combining the best aspects of tree and text representation models, logs are more readable, and each log entry includes contextual information, helping you quickly understand where it’s coming from.
With Wallaby v2, we have also introduced Value Peek, a feature that allows you to quickly see any value just by hovering over it. To keep your editor clutter-free, values shown this way will not appear next to your code by default (but can be made to appear using the Explore Value action available in the hover).
Side View
While the Overview panel focuses on short-term testing tasks, the Side View is dedicated to strategic operations, offering a real-time overview of all tests, coverage, logs, status, and more.
The Tests tab offers a test-centric overview and analytics for your project. The test tree displays all your tests in real time, with filters to focus on failing tests, long-running tests, or tests marked as “todo” or skipped. The selected test or file also shows the source files covered by the test, including test coverage metrics.
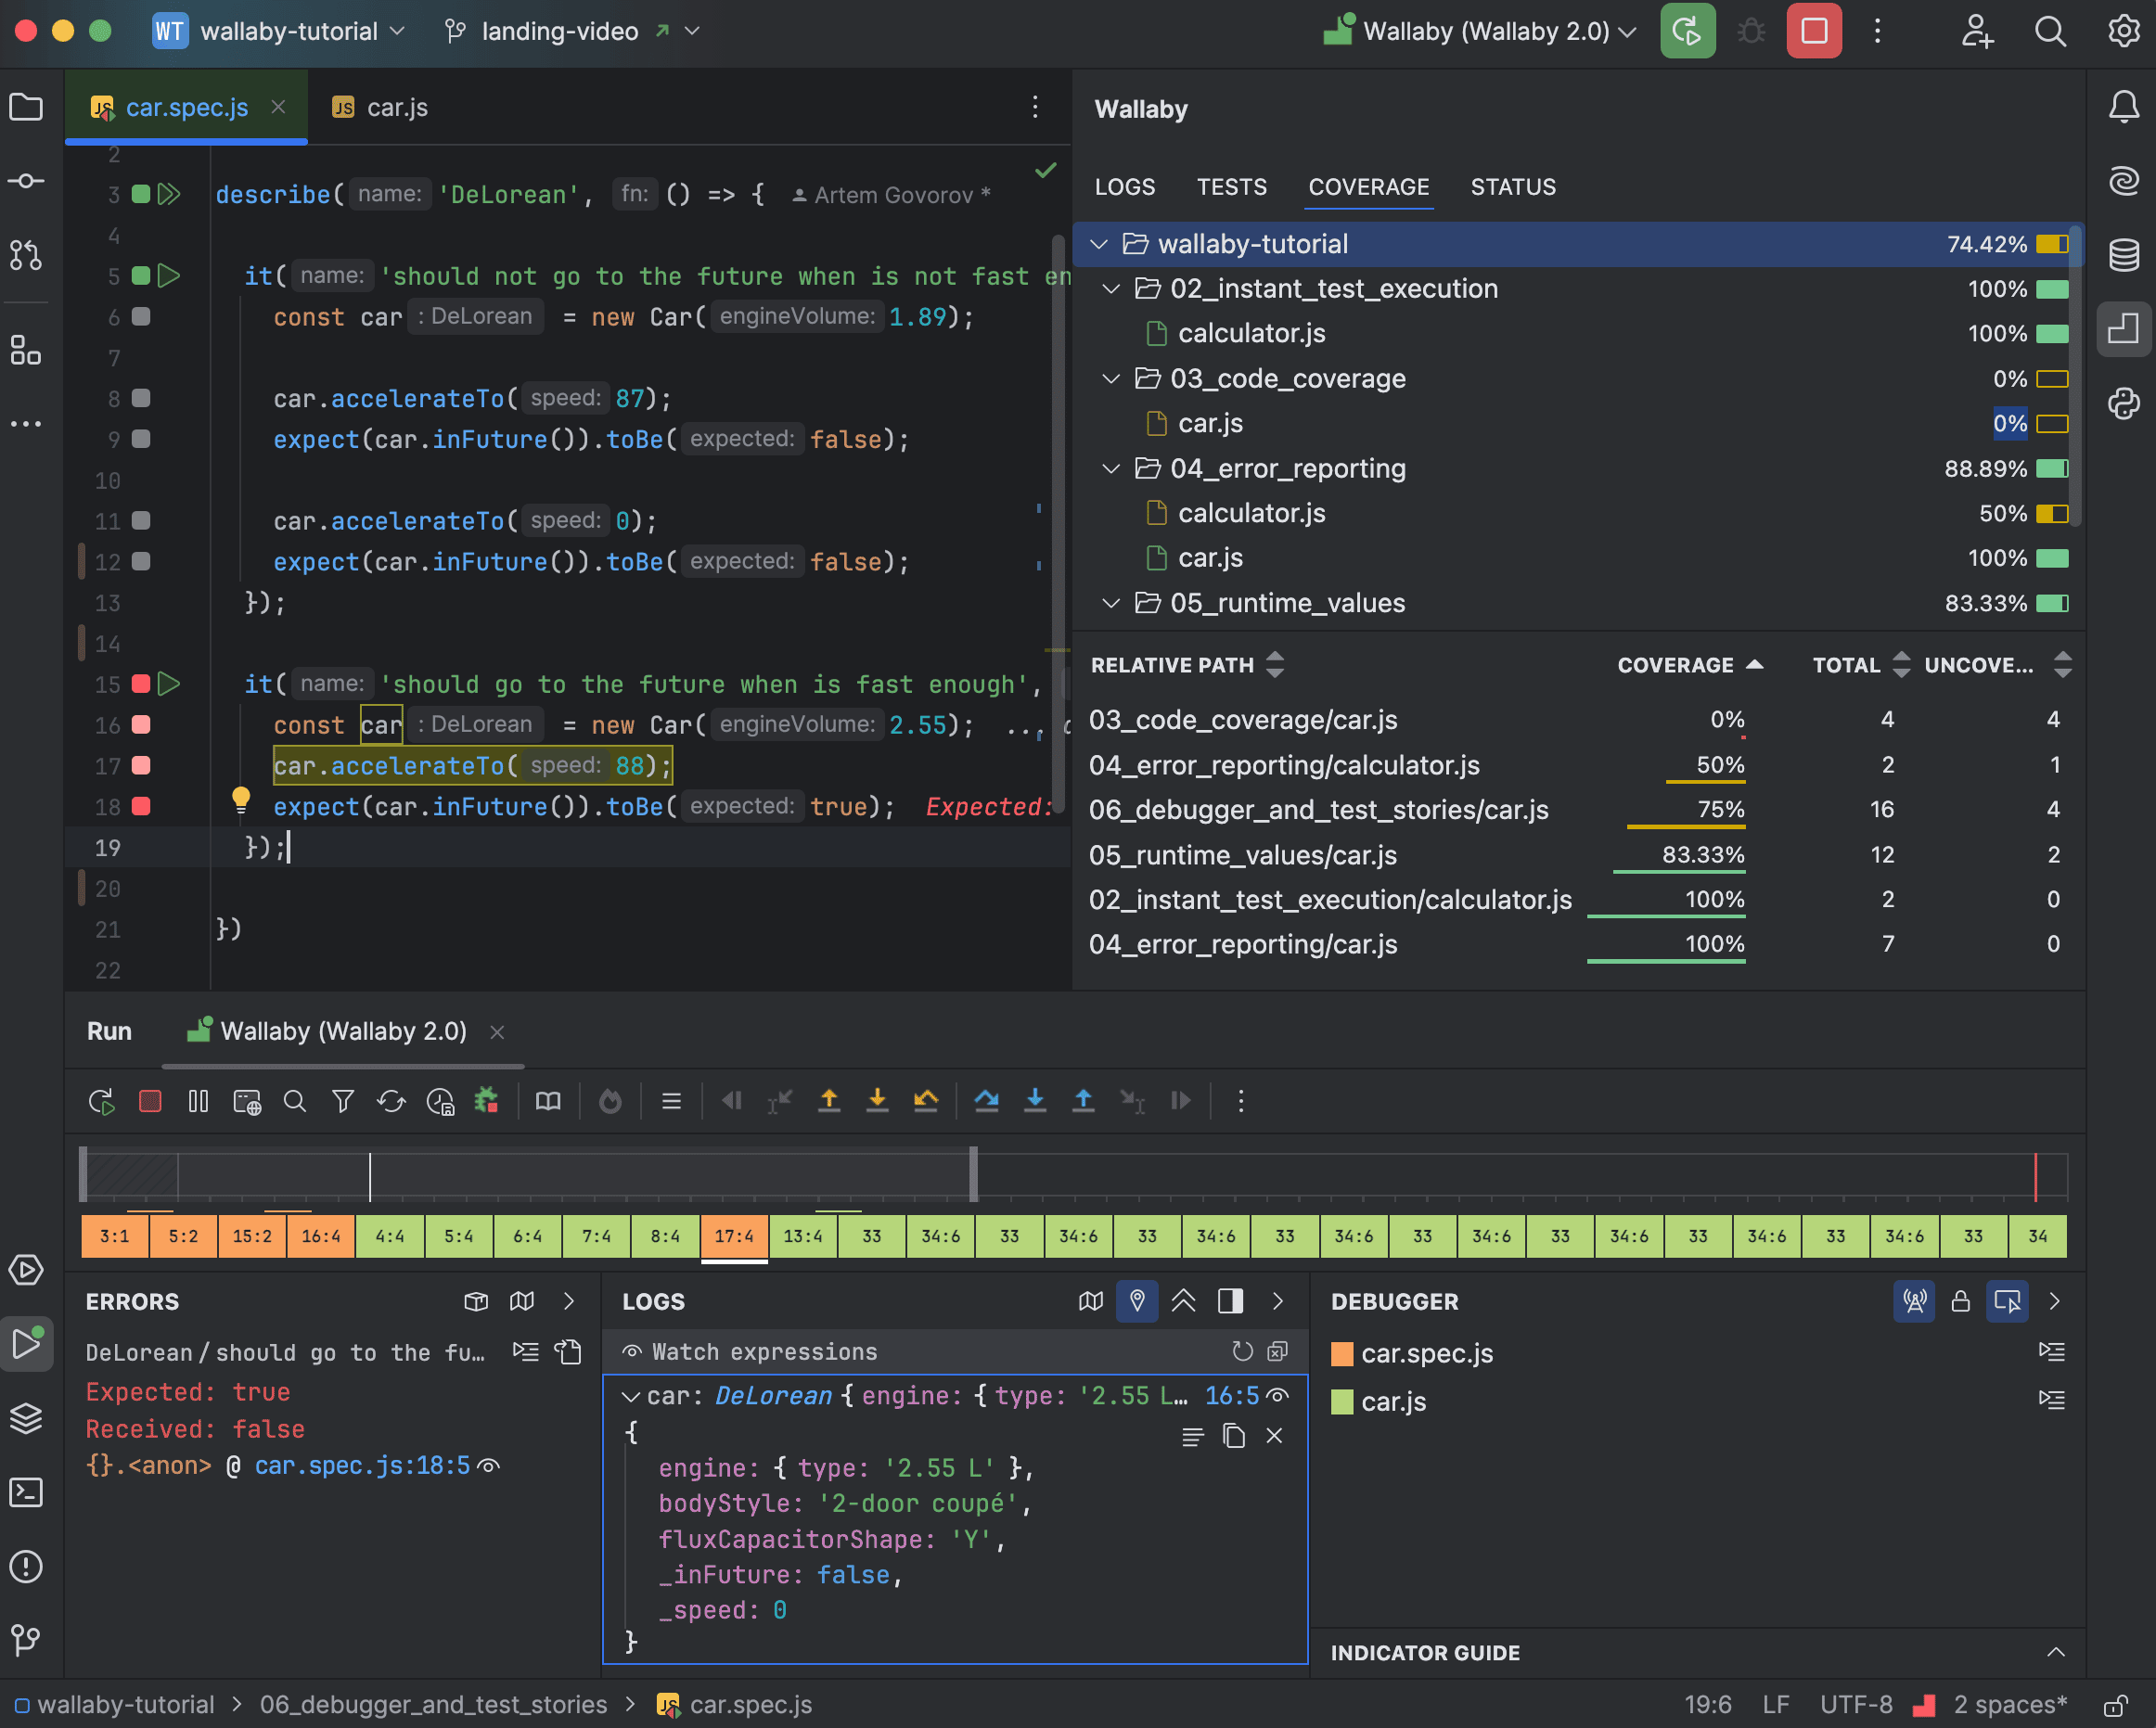
The Coverage tab provides a file-centric overview and analytics for your project. It combines an annotated project file tree with a sortable list of files in selected folders/modules. This allows you to browse the tree structure, see aggregated coverage values, and easily identify the least-covered files, regardless of folder depth. You can also select individual files to view their code coverage.

The Logs tab is similar to the overview logs but designed for larger logs or more log entries. You can open it from the overview panel when you need more vertical space to explore and focus on specific log entries.
The Status tab helps you quickly assess the current execution status and troubleshoot issues. For instance, if a test is taking too long, you can easily identify it and take necessary actions to address the problem.
Interactive Timeline and Watch expressions
In today’s AI-driven development environment, where significant amounts of code are generated automatically, better visualization of runtime data and enhanced debugging tools are critical. AI-generated code and tests must be reviewed and understood; otherwise, maintaining the code can become complex and costly. Wallaby v2 introduces an interactive timeline that helps you navigate the steps of your test execution, making Wallaby Time Travel Debugger faster and more insightful.
The timeline offers a zoomable view of your test execution, allowing you to quickly identify key stages in your code, such as pre-test setup, test imports, test execution, and post-test cleanup. Depending on the zoom level, the timeline shows transitions between different files, functions, and code lines. It also highlights markers, logs, and errors, showing where they occurred along with past and future hits for the current line—providing valuable context for debugging.
With Wallaby v2, you can explore values while debugging using persistent watch expressions. Simply hover over a variable or expression in your code to add it to the watch list. You can view the value directly from the hover or in the logs viewer. Unlike in Wallaby v1, the watch expressions in Wallaby v2 are persistent, auto-updated, and can be re-evaluated at any time if needed.
Linked Mode and Standalone Mode
In addition to full editor integration for VS Code and JetBrains IDEs, Wallaby v2’s UI is available in two modes: Linked Mode and Standalone Mode.
Linked Mode
Wallaby Linked Mode allows you to use Wallaby’s new UI in a separate browser window, connected to your editor (VS Code, JetBrains IDEs, Visual Studio, Sublime Text). It offers a seamless experience with easy navigation between the editor and Wallaby UI. For VS Code and JetBrains IDEs, the Wallaby UI theme matches your editor’s, ensuring a consistent look and feel.

The Linked Mode also includes a code viewer that allows you to choose between viewing code in your editor or directly in Wallaby UI. This feature provides a convenient way to pick the best view for your current task, ensuring you have the flexibility you need to work efficiently.
To open Wallaby Linked Mode, after starting Wallaby:
- in VS Code, click the external icon in your editor’s overview panel, or use the
Wallaby.js: Open in Browsercommand in the command palette. - in JetBrains IDEs, click the
Open Wallaby in Browsericon in the Wallaby tool window. - in Visual Studio, open the Output tool window, select
Wallaby.js - Consoleand use the URL provided after theWallaby 2.0 features are available atmessage. - in Sublime Text, run the
Wallaby.js: Open Wallaby in Browsercommand.
Standalone Mode
Wallaby Standalone Mode, also known as Wallaby for any editor, allows you to use Wallaby with any editor without the need for an editor extension. This mode is perfect for editors like Neovim, Vim, Zed, Emacs, Fleet, and more. To get started, simply run npm install -g @wallabyjs/cli && wallaby in your project’s root. You can then choose your preferred theme and access the Overview, Side Panel, Code Viewer, Time Travel Debugger, and all other features, providing a comprehensive testing experience in any editor.
Standalone Mode differs from Linked Mode in that it is designed to be used independently of any specific editor. All navigation and interaction with Wallaby UI is available directly in the browser window, and code navigation and code preview are available in the Wallaby UI Code Viewer.
Current Editors Support
Below is a list of editors that are currently supported by Wallaby v2, along with the available integration modes:
| Editor | Editor Integration | Linked Mode | Standalone Mode |
|---|---|---|---|
| VS Code, Cursor | ✓ | ✓ | ✓ |
| JetBrains IDEs | ✓ | ✓ | ✓ |
| Visual Studio | ✓ | ✓ | |
| Sublime Text | ✓ | ✓ | |
| Neovim, Zed, Vim, Fleet, Emacs, and other editors | ✓ |
Upgrade/downgrade instructions
VS Code and JetBrains IDEs
Wallaby v2 UI is enabled by default in VS Code and JetBrains IDEs since the latest Wallaby extension/plugin update.
The Wallaby v2 UI replaces Wallaby App and provides a more integrated and seamless experience. To achieve the same Wallaby App experience, we recommend using the new Side Panel in your editor, or Wallaby Linked Mode to open in your browser window.
We understand that transitioning to a new UI can be challenging and in order to make the process as smooth as possible and minimize disruptions, you may quickly switch back to the Wallaby v1 UI in VS Code and JetBrains IDEs if needed:
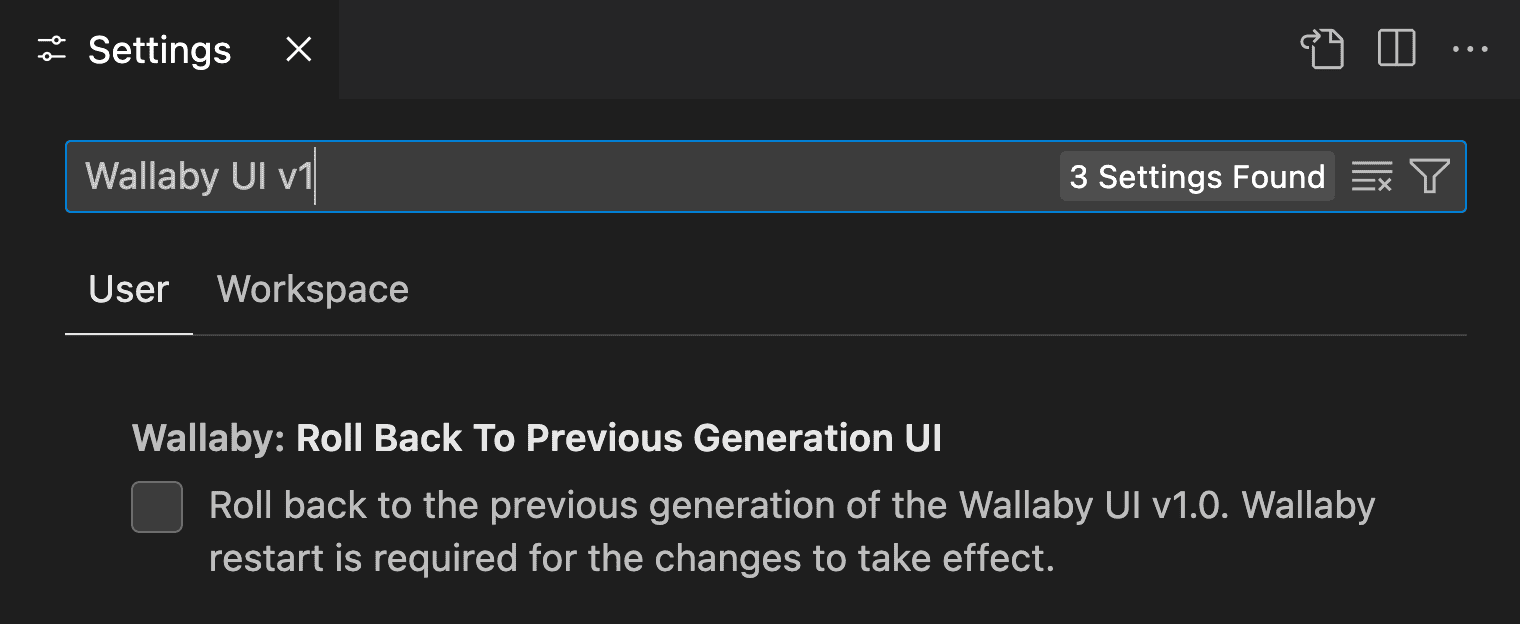
- In VS Code, you can switch back to Wallaby v1 UI using the
wallaby.rollBackToPreviousGenerationUIsetting in your user settings.
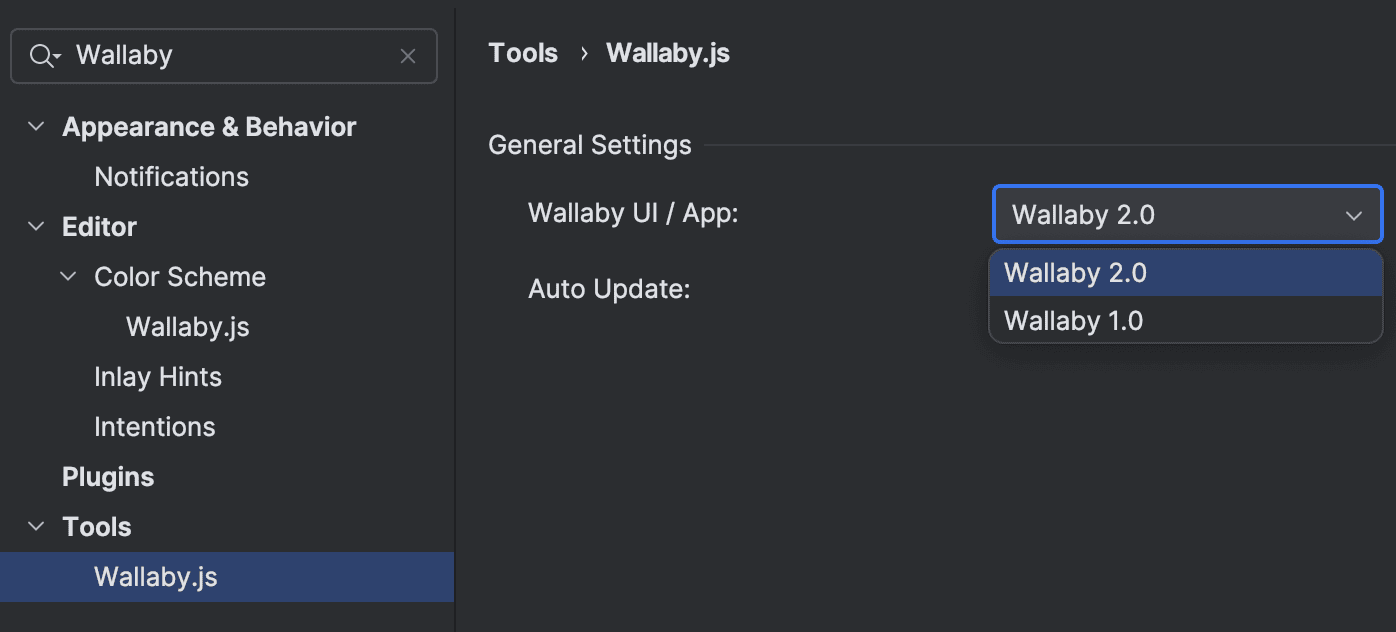
- In JetBrains IDEs, you can switch back to Wallaby v1 UI using the
Wallaby UI/Appsetting in the plugin settings.
If you switch back to Wallaby v1 UI, Wallaby App is available via the same Wallaby App URL(s) as before.
Visual Studio and Sublime Text
Wallaby v2 UI is available in Visual Studio and Sublime Text via Wallaby Linked Mode; no special steps to upgrade or downgrade are required.
- in Visual Studio, open the Output tool window, select
Wallaby.js - Consoleand use the URL provided after theWallaby Linked Mode is available atmessage. - in Sublime Text, run
Wallaby.js: Show Consolecommand and use the URL provided after theWallaby Linked Mode is available atmessage.
Wallaby App is also available in Wallaby v2 via the same Wallaby App URL(s) as before.
Neovim, Vim, Zed, Fleet, Emacs, and other editors
To get started, simply run npm install -g @wallabyj/cli && wallaby
in your project’s root.
Once Wallaby UI is opened, you can then choose your preferred theme via settings, and use the Overview, Side Panel, Code Viewer, Time Travel Debugger, and all other features.
Tooltips & Keyboard Shortcuts
Wallaby v2 introduces new tooltips to help you navigate the UI and understand the various features and options available. Hover over any icon, button, or element to reveal a tooltip with a brief description of its functionality, as well as any keyboard shortcuts associated with it.
Mnemonic keyboard shortcuts support in Wallaby UI ensures a streamlined and uninterrupted testing experience, making it a great choice for users who rely on shortcuts to optimize their workflow.
Conclusion
Wallaby v2 marks the beginning of a new era for Wallaby.js. While it is the most significant update in nine years, it is just the start.
When running your tests, Wallaby has access to a wealth of valuable data and insights beyond what it currently shares. This new UI development approach paves the way for the features and improvements we’ve long envisioned. We are excited to bring these enhancements to you in upcoming releases.
We are also thrilled to announce that Quokka 2 is in the works to bring you the same level of innovation and improvements that Wallaby v2 has introduced.
Explore Wallaby v2, try out the new features, and share your feedback with us. Your input is invaluable as we continue to refine and enhance Wallaby to meet your evolving needs.