Introducing Output Inspector
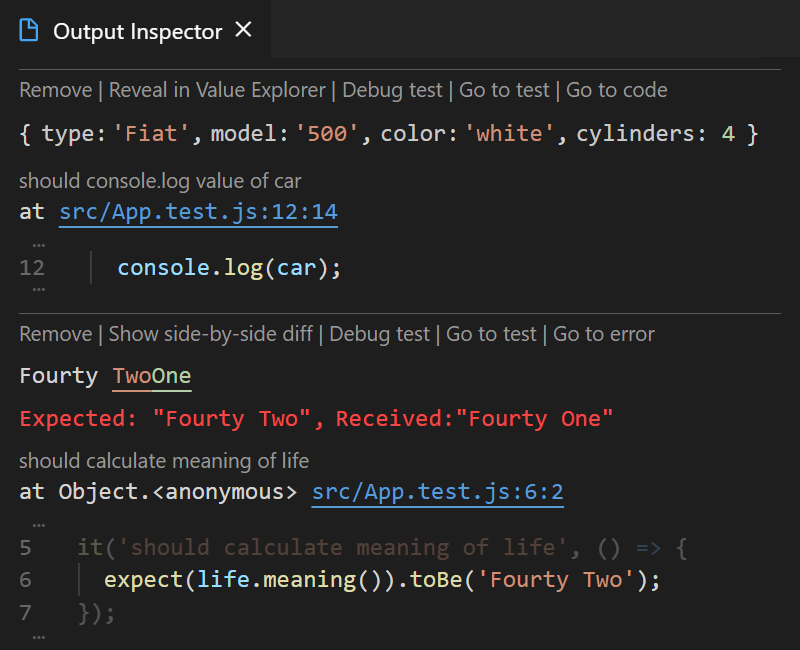
Today we’re excited to announce a really cool new feature called Output Inspector that is really going to improve your debug productivity. Output Inspector allows you to inspect logged values and error messages within your editor in a pop-out code window.
Initially the feature is only available in VS Code but it is coming soon for JetBrains editors.
How does it work?
When you use Live Comments or Live Value Display features and a logged value is too long to display as an inline message in your editor, Wallaby now automatically shows the value in Output Inspector.
To inspect an error, simply select the line with the error in your editor or else use the new Show error
context action or the new Show Error command. This will display the error message and stack trace, along with additional context
from your source file to allow you to quickly understand why the error occurred.
Some information in Output Inspector is also available in Value Explorer and the Wallaby Tests window. Because Output Inspector displays the information in a code window, you can use your keyboard to navigate and interact with Output Inspector just like if you were writing code. Besides keyboard productivity, staying in a “writing code” mindset also helps keep your flow.
You may find more information about the feature in our documentation.
What is next?
Our plan for the feature is to next implement it for JetBrains editors and then provide the same functionality in Quokka.js for VS Code and JetBrains editors.
We hope you enjoy using Output Inspector!
Thanks for reading! As usual, we would love to hear your feedback on Twitter, or via our GitHub repo.