Wallaby’s Time Travel Debugger allows you to move forward and backwards through your code to understand the conditions that led to a specific bug. With built-in support for edit-and-continue you don’t have to stop or even restart the debugger as you change your code. You can even leave the debugger on while working on new features.
The time travel debugger really accelerates your edit, compile and debug loop by allowing you to jump to a specific line of code, view run-time values, edit-and-continue and step into, over and out of your code.
Read on for more details about what the debugger experience is like in JetBrains IDEs…
Starting the Debugger
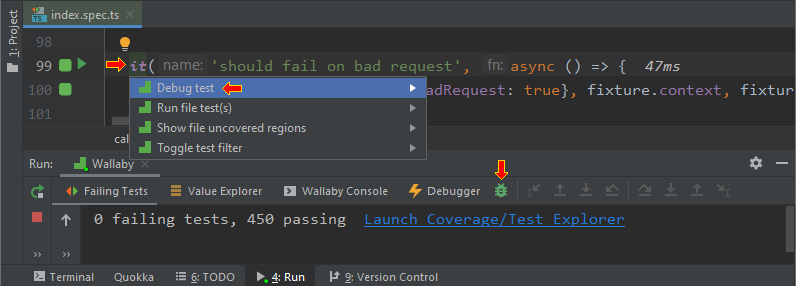
Start the time-travel
debugger by focusing your cursor on any line of code with a Wallaby coverage indicator that
shows the line was executed by Wallaby. Navigate to the line of code where your test starts and
run the intention action, Debug test or else
start the debugger from the IntelliJ Run Tool Window.
Debugger View
The Debugger View displays all information related to your debug session and provides the ability to quickly navigate to important parts of your project that were detected during the test run. Debug Actions are available from from the header of the Wallaby Run Tool window as well as via keyboard shortcuts, supporting the following commands: Run Back to Active Line, Step Back Out, Step Back Into, Step Back Over, Stop Debugger, Step Over, Step Into, Step Out, and Run to Active.
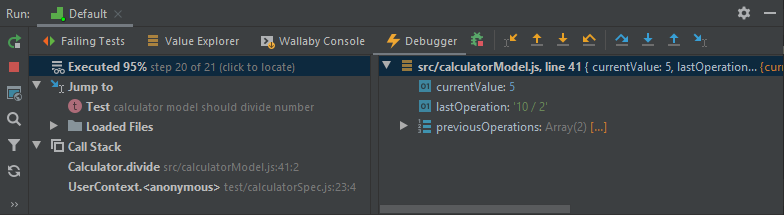
Inspecting Runtime Values
Inspecting runtime values during time-travel debug sessions is quick and easy. All you need to do is select the object, object property, parameter, expression or variable that you want to view. When you do this, Wallaby will display the value that you selected beside your code, and in the Debug view’s Value Explorer.
Edit-and-continue
One of the cooler features of the debugger is native support for edit-and-continue. Simply edit your code at any time and continue debugging it.
You may also like to read the tips and ticks section of the Time Travel Debugger docs for additional productivity hints.