What's New


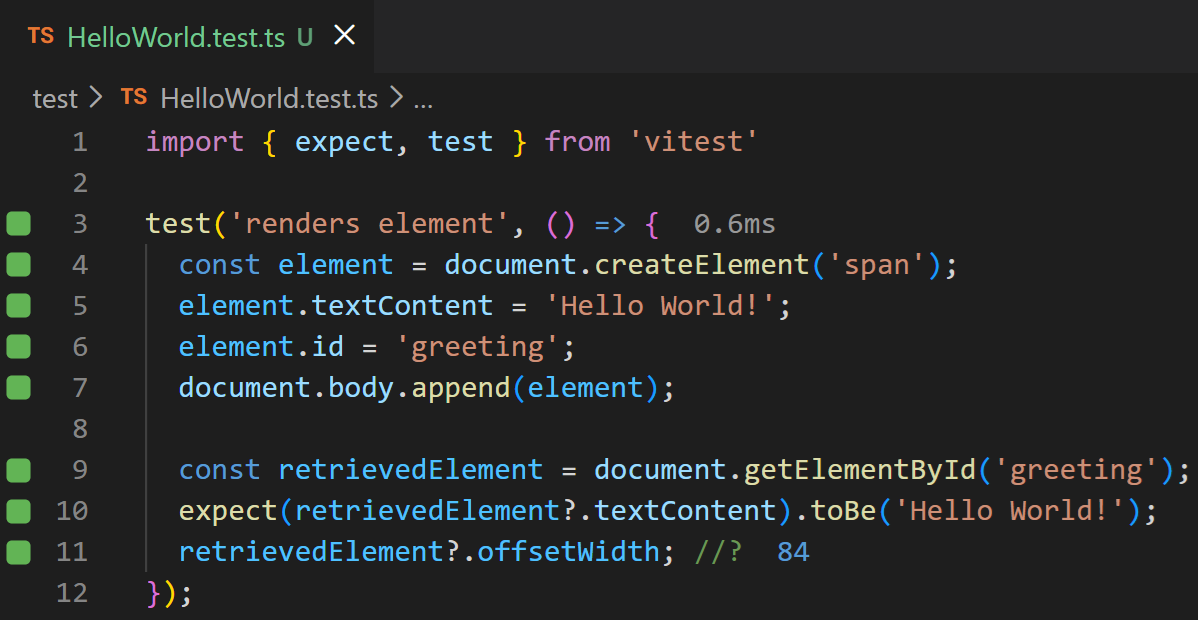
Wallaby now supports the latest version of vitest (v4.1.x+). The recent update of vitest included major breaking changes that required updates to Wallaby’s vitest integration.
For Angular CLI v21 workspaces and projects, Wallaby now automatically detects and configures the default Vitest runner. Wallaby runs tests in Node.js environments such as jsdom and happy-dom, or in browsers via playwright or webdriverio, and provides better incremental run performance, reliability, and live results streaming.
Wallaby now supports running Vitest v4.x+ in browser mode, using either the playwright or webdriverio providers. Wallaby will run your browser instances in headless mode by default (overridable by setting headless: false in your vitest config).
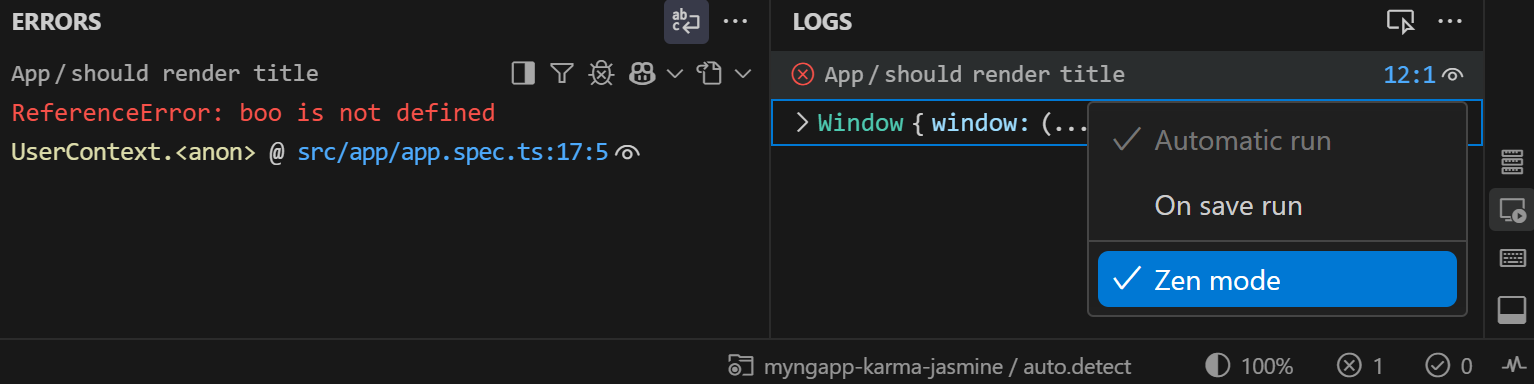
We’re excited to introduce Zen Mode, a new Wallaby.js feature that gives you control over when you see test feedback in your editor.
Wallaby’s MCP server tools are now available in JetBrains editors. Read more about how to enable it in our docs.
Wallaby UI now supports peeking into source code locations directly from various views, including the Test list and Test
tree, Error panels, Logs list, etc. Pretty much any UI element that has a source code location associated with it will
now allow you to peek into the source code without navigating away from your current context. To use the feature,
simply press the . key when focused on an item with a source location.
Wallaby now supports the latest version of vitest (v4.x+). The recent update of vitest included major breaking changes that required updates to Wallaby’s vitest integration.
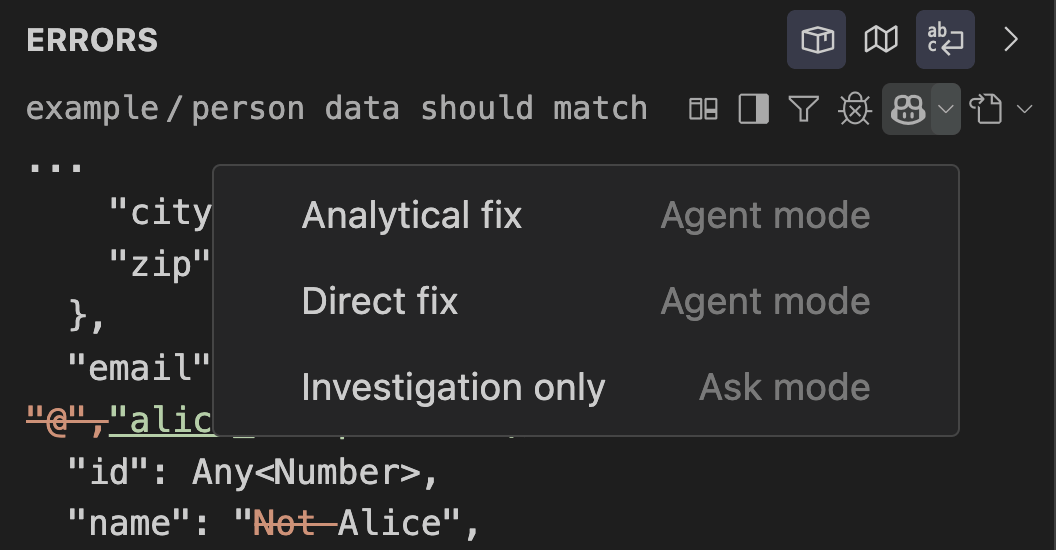
We have added a mode selector to Wallaby Copilot integration, allowing you to choose between different modes of operation, such as Investigation, Analytical Fix and Direct Fix. This provides more flexibility in how the Copilot prompt is generated and what level of detail is provided to the AI model. We have also added code lens action for failing tests to quickly switch between modes.
Wallaby’s v3 release shipped with some large-scale changes to our Vitest integration. These changes shift responsibility for determining test execution order from Vitest to Wallaby and provide a more responsive test execution experience. Since the release, we have made several changes to improve performance and reliability for issues that could affect larger projects. We’re continuing to work on further enhancements to make Wallaby and Vitest work even better together.
We have updated Wallaby to log multiple values for identifier expressions (i.e., variable names), limiting the number of logged values and traversal depth, while clearly indicating when the count limit is reached. Previously, a single value was logged for identifier expressions, which could lead to incomplete or misleading information.