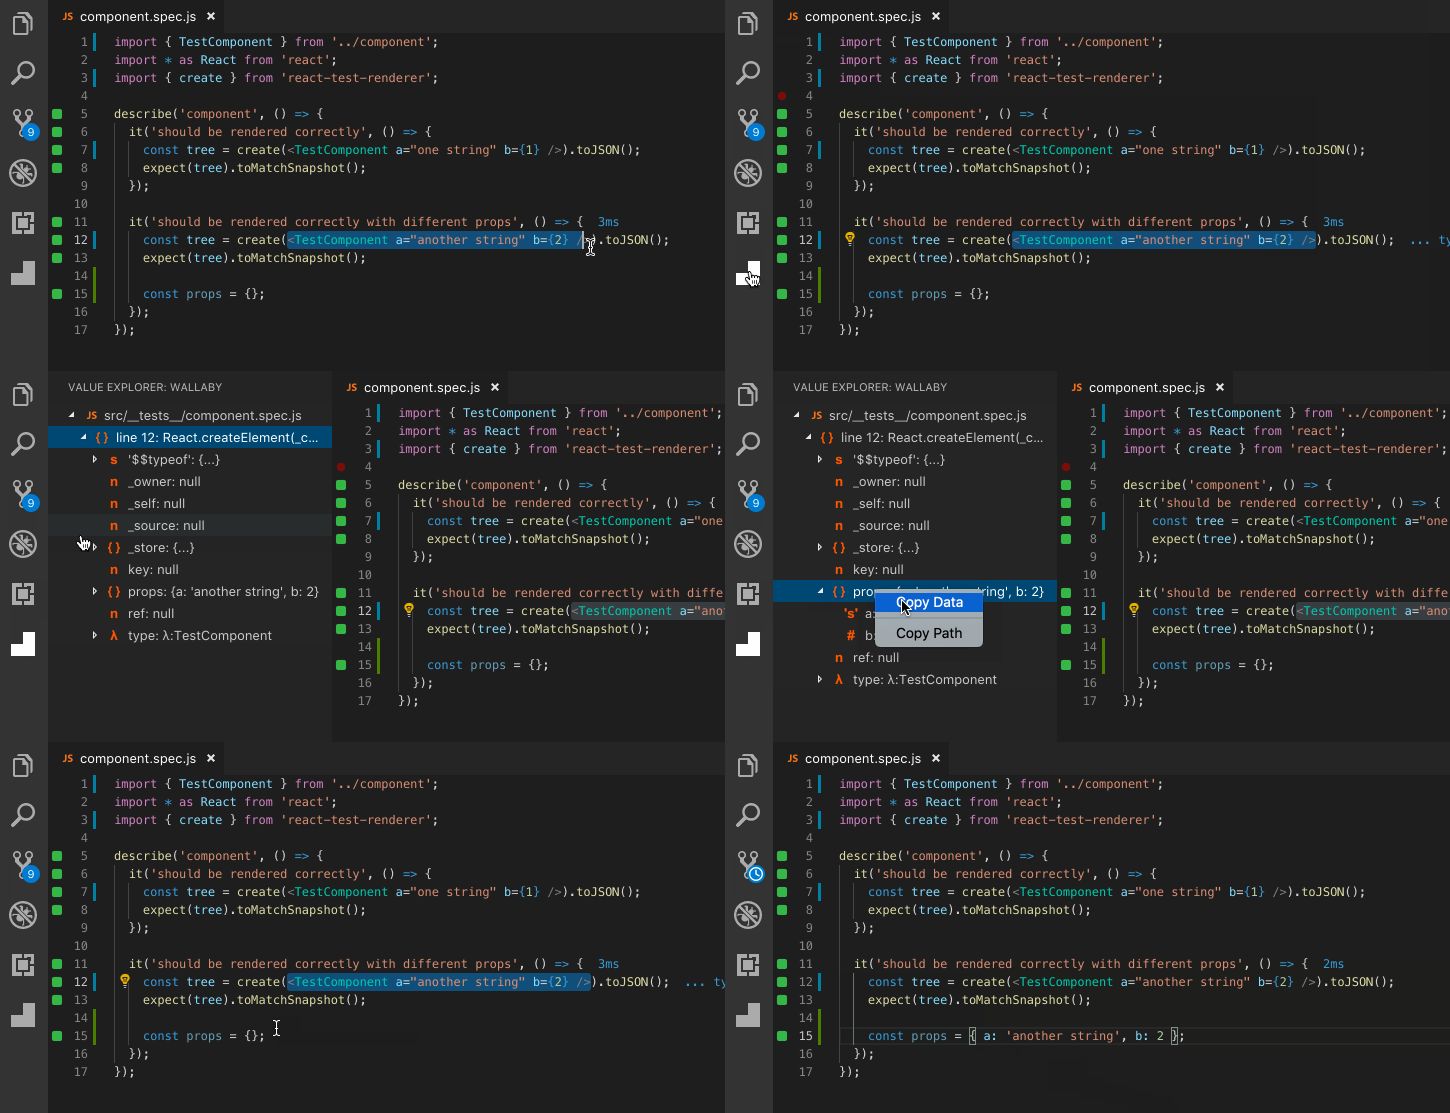
Value Explorer
integrates with Wallaby’s existing variable and expression output mechanisms (console.log, live comments,
identifier expressions, and the Show Value command) to
display values in an easy-to-navigate, real-time tree view. The tree can be expanded to any depth
and can copy paths/values to the clipboard.

The feature allows you to explore values anywhere in your code and tests just as you would in a classical debugger, but without having to start and attach a debugger, place any breakpoints (or even add a console.log statement).
Today, the feature is available in Wallaby (and Quokka) for VS Code. We are pleased to announce that over the next few months the feature will also be available in:
- Wallaby for JetBrains IDEs,
- Quokka for JetBrains IDEs,
- Wallaby App.
As usual, we would love to hear your feedback on the feature on Twitter, in our comments, or our GitHub repo.