What's New (Page 8 of 11)


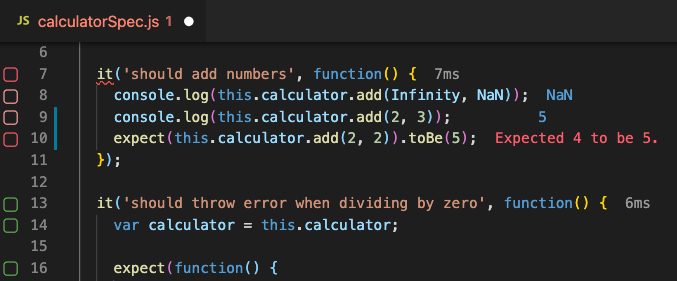
Wallaby for VS Code and JetBrains editors has two new commands, Show Line Value(s) and Show Line Timing(s). Simply select the line(s) of code and use the commands to see the values or execution times.
Wallaby now includes support for Vitest, from Vitest@0.14.0+. Vitest is a vite-native unit testing framework that was first released in December, 2021. Please report any issues or feedback to us via our github issues repository.
Wallaby’s new Smart Start feature allows you to quickly start Wallaby and only the test file(s) that you are currently working on will be executed. As soon as you open another test file, Wallaby will automatically run those tests and Wallaby will continue to execute those tests when they are affected by your code changes. Smart Start can be configured to always run a set of test files on start, and you can customize the automatic test execution behavior to run on edit (instead of open), or to never run automatically.
Automatically expanded objects (logged with the special comment //?+) now resolve property getters. So in case of const a = { get b() { return 1; } }; //?+ the output will be { b: 1 }. If you want to always resolve property getters regardless whether the logged object is automatically expanded or not, you may use the new resolveGetters configuration setting.
Wallaby now highlights HTML output for logs and Testing Library errors. Unlike the ANSI colored output in your editor terminal test run results or basic built-in test output support, Wallaby output is highlighted using your editor theme, so all color settings are under your full control.
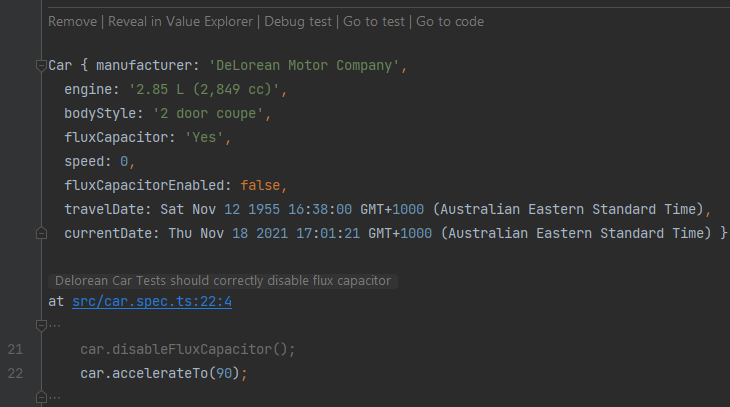
Time Travel Debugger now displays console logs, live comments and identifier expressions. Previously Wallaby debugger was hiding the logs (to inspect runtime values during time-travel debug sessions you need to select the expression or variable that you want to view). Now when the currently debugged line is a console log, a line with a live comment, or an identifier expression, then the current value gets logged and is available for inspection inline as well as in Value Explorer and Output Inspector.
Output Inspector is now available for JetBrains editors. It provides an ergonomic and convenient way of inspecting logged values and error details in a rich editor-friendly manner. Information is displayed in a code editor window, providing rich keyboard support and allowing you to stay in your coding mindset so that you don’t lose your flow.
The latest version of Wallaby for VS Code now shows coverage indicators for the last test
run when run on save is enabled. This behavior can be changed with the VS Code setting, wallaby.runOnSaveIndicators.
Wallaby App’s automatic test selection has been improved. Previously test selection would automatically focus on the first failing test regardless of test filtering. Now, test selection will only focus on filtered tests when a filter is applied.
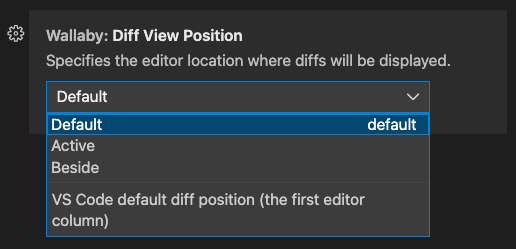
Wallaby for VS Code provides a new setting to control where the diff view is opened. The default is to open the diff view in the first view column.
You may instead configure diff views to open in the active (current) view column or beside the current view column.