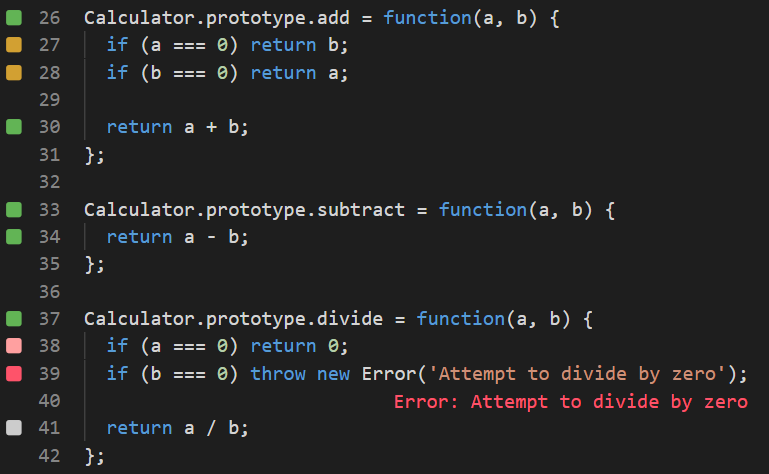
When executing your tests and code, Wallaby calculates code coverage to identify which statements of your code have been executed and which statements have not.
Code coverage for your application code is displayed in the left margin of your editor and is updated in real-time. As soon as you start changing your code, the coverage will be automatically updated.
In addition to in-editor code coverage indicators, summary code-coverage statistics are available in Wallaby App.
Editor Code Coverage Indicators
Wallaby has five different types of code coverage indicators that are displayed in the left margin of your editor as shown in the screenshot below.

Here is what the coverage indicators mean:
Uncovered Code Regions
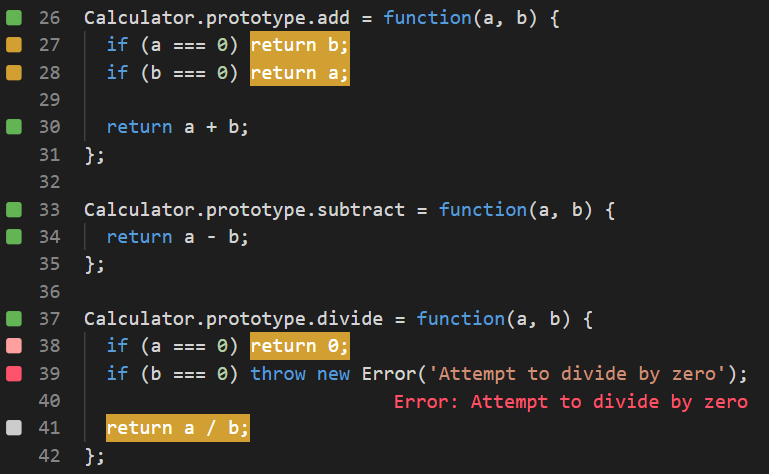
Wallaby’s Toggle Uncovered Code Regions feature allows you to quickly highlight regions of your code that have not been executed
(i.e. for lines with coverage indicators that are Yellow or White). Refer to the relevant tutorial for your editor to see
how to use this command (VS Code,
JetBrains,
Visual Studio,
Sublime). This feature is especially useful identifying uncovered code as you work
to improve code coverage.
Tip: use Wallaby App to view your code in read-only mode with uncovered regions always highlighted.

Coverage Settings
It is possible to adjust code coverage calculations and reporting with configuration and code comments. Refer to the configure coverage section of our docs for more information.