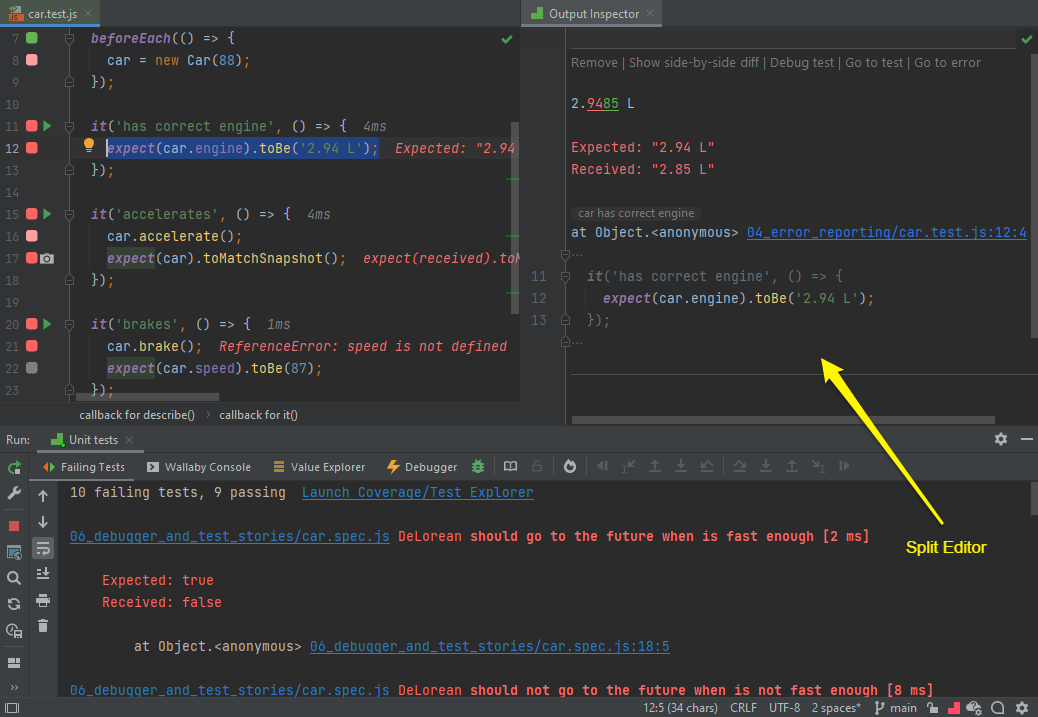
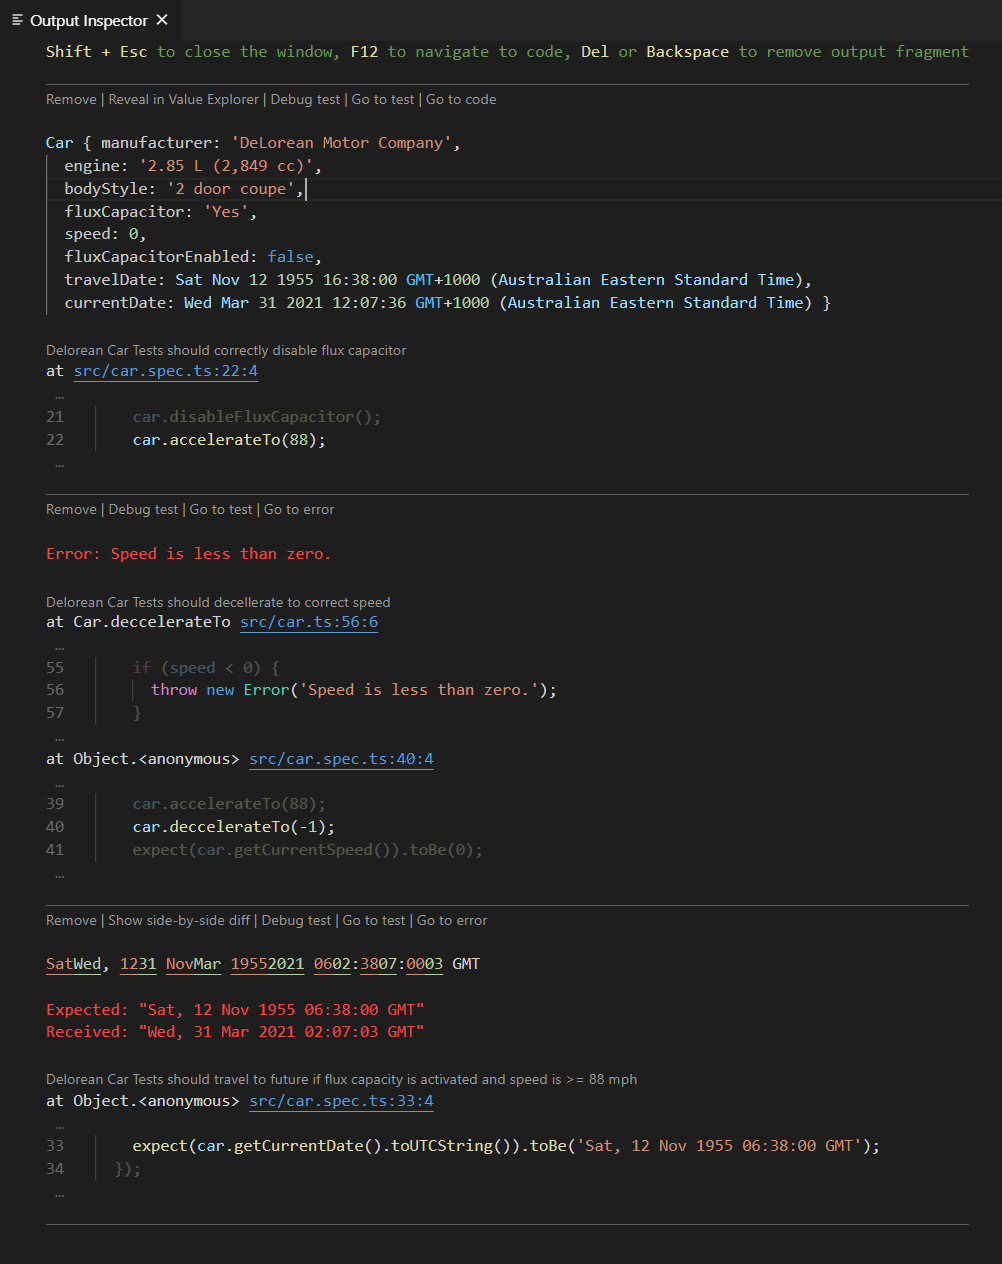
Wallaby’s Output Inspector provides you with an ergonomic and convenient way of inspecting logged values and errors details in a rich editor-friendly manner.
Select your editor
The information on this page is adjusted to your editor of choice. Please select your editor by clicking on your editor’s logo below before proceeding with the tutorial:
Opening Output Inspector
When you use Live Comments or Live Value Display features and a logged value is too long to display as an inline message in your editor, Wallaby automatically shows the value in Output Inspector.
To inspect an error you may select a line with the error in your editor or else use the Show error context action or the Show Error command.
To inspect an error you may select a line with the error in your editor or else use the Show error intention action or the Show Error action.
Working with Output Inspector
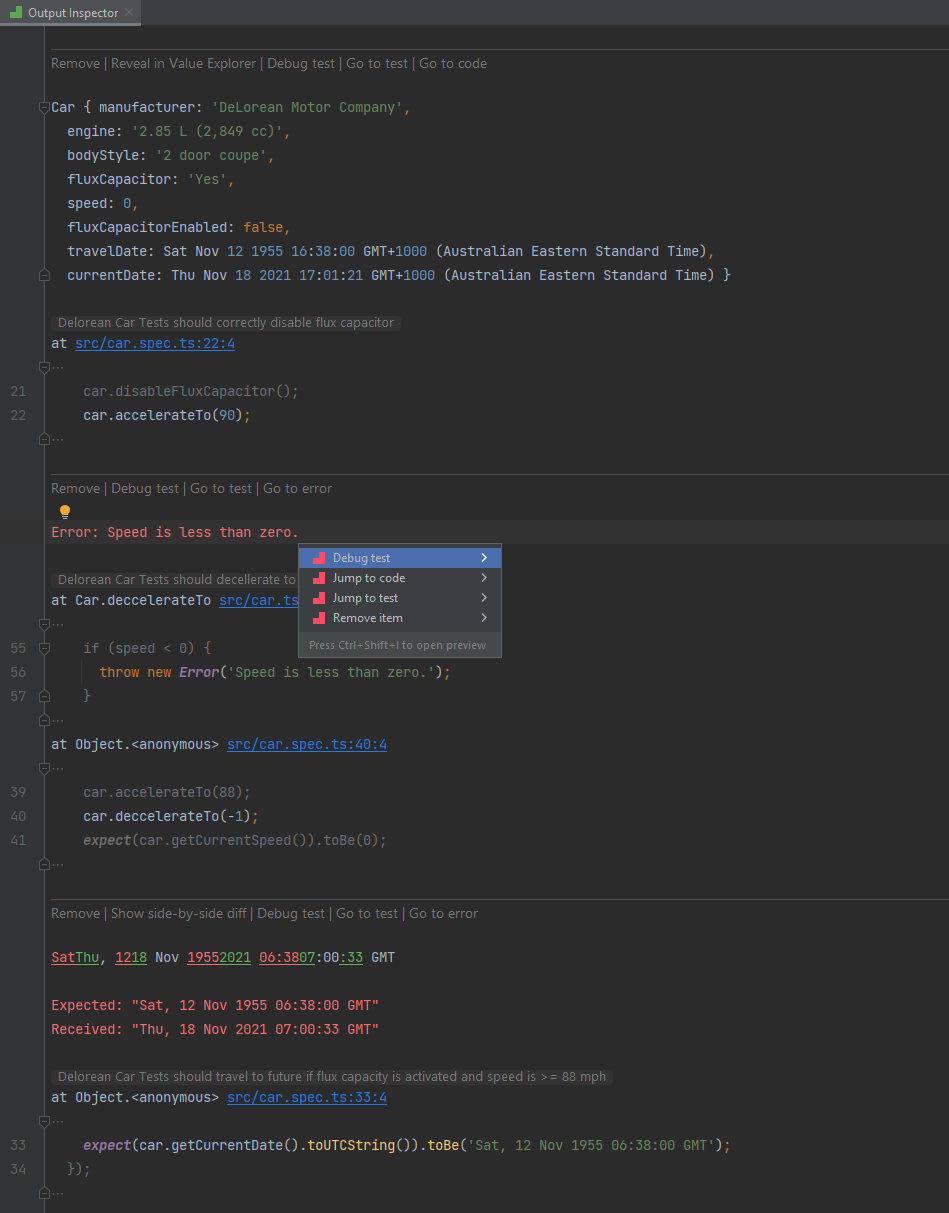
Output Inspector is a readonly code editor instance that has all basic built-in editor features such as syntax highlighting, copying, search etc. On top of that it provides a set of unique context specific actions implemented as code lens, commands and keyboard shortcuts which make it even easier and quicker to analyze and fix your test failures.
The main navigation shortcut is F12 which navigates you to source code depending on your current context (where your cursor is). For errors, you may also Go to error, Go to test, Debug test, Show side-by-side diff, Update test snapshots, and Go to snapshot. For Live Comments or Live Value Display you may use Go to code, Go to test, Debug test and Reveal in Value Explorer by using the code lens actions.
Depending on your current context (where your cursor is) there are multiple useful intention actions (Alt+Enter) available for you. For errors, you may use Go to error, Go to test, Debug test, Show side-by-side diff, and Update test snapshots. For Live Comments or Live Value Display you may use Go to code, Go to test, Debug test and Reveal in Value Explorer by using the code lens or the intentions actions.
Once Output Inspector’s window is opened beside your main code editor you may switch focus to it and back by pressing Ctrl+Shift+/ shortcut (or by calling Toggle Output Inspector Focus command).
To close Output Inspector you may use Shift+Escape shortcut (Close Output Inspector command).
Once Output Inspector’s window is opened you may switch focus to it and back by pressing Alt+Shift+\ shortcut (or by calling Toggle Output Inspector Focus action).
To close Output Inspector you may use Alt+Shift+Backspace shortcut (Close Output Inspector action) or Escape shortcut if it is in Split Editor view mode.
Output Inspector can show multiple output fragments (errors and/or values) together, however if you are not interested in some of them anymore then you may delete them by pressing Del or Backspace keys anywhere inside an output fragment. In addition you may use the Remove code lens above each output fragment.
Output Inspector can show multiple output fragments (errors and/or values) together, however if you are not interested in some of them anymore then you may delete them by pressing Shift+Alt+Del keys or calling Remove item intention action anywhere inside an output fragment. In addition you may use the Remove code lens above each output fragment.
Settings
By default, Output Inspector is automatically displayed for large objects and errors. You may configure it to never automatically display, only automatically display for errors, or automatically display for all values (including smaller ones) using the Automatic Display and Automatic Display Debugger Override Wallaby settings:
By default, Output Inspector is automatically displayed for large objects and errors. You may configure it to never automatically display, only automatically display for errors, or automatically display for all values (including smaller ones) using the Automatic display and Automatic display debugger override Wallaby.js Output Inspector settings:

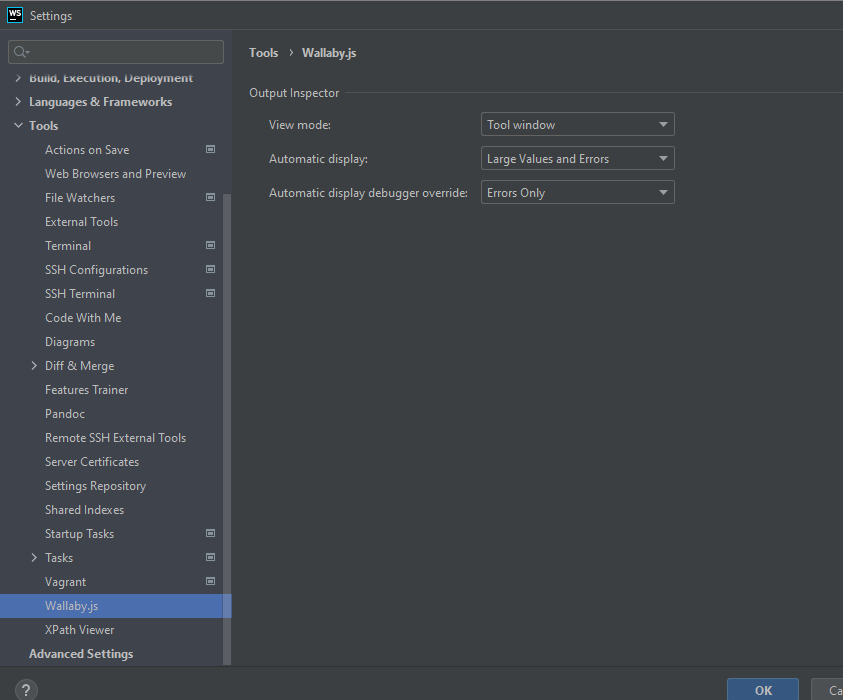
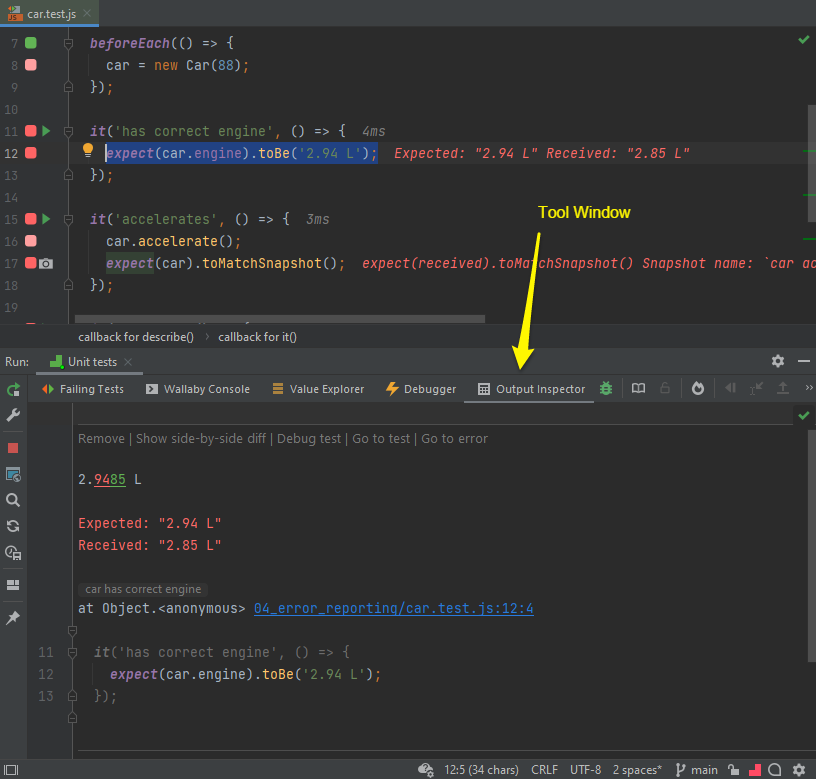
There is also a Vew mode setting which allows you to specify whether Output Inspector is displayed in the Wallaby tool window or as a split editor.
Tool Window
Split Editor
