 Wallaby App is a web application that provides strategic level features, such as coverage reports and the realtime bird’s eye view of your project’s tests connected to your editor.
The app is available at wallabyjs.com/app and at http://localhost:51245 (it is exactly the same app, just hosted locally).
Note that you need to have wallaby.js configured and running in your editor to use the most of the app.
It’s also worth mentioning that, despite being a web application, wallaby app doesn’t upload any of your project’s source code to the cloud, it just makes a connection to the locally running wallaby core. If you like, you may easily check it in your browser’s Dev Tool Network panel.
Tests
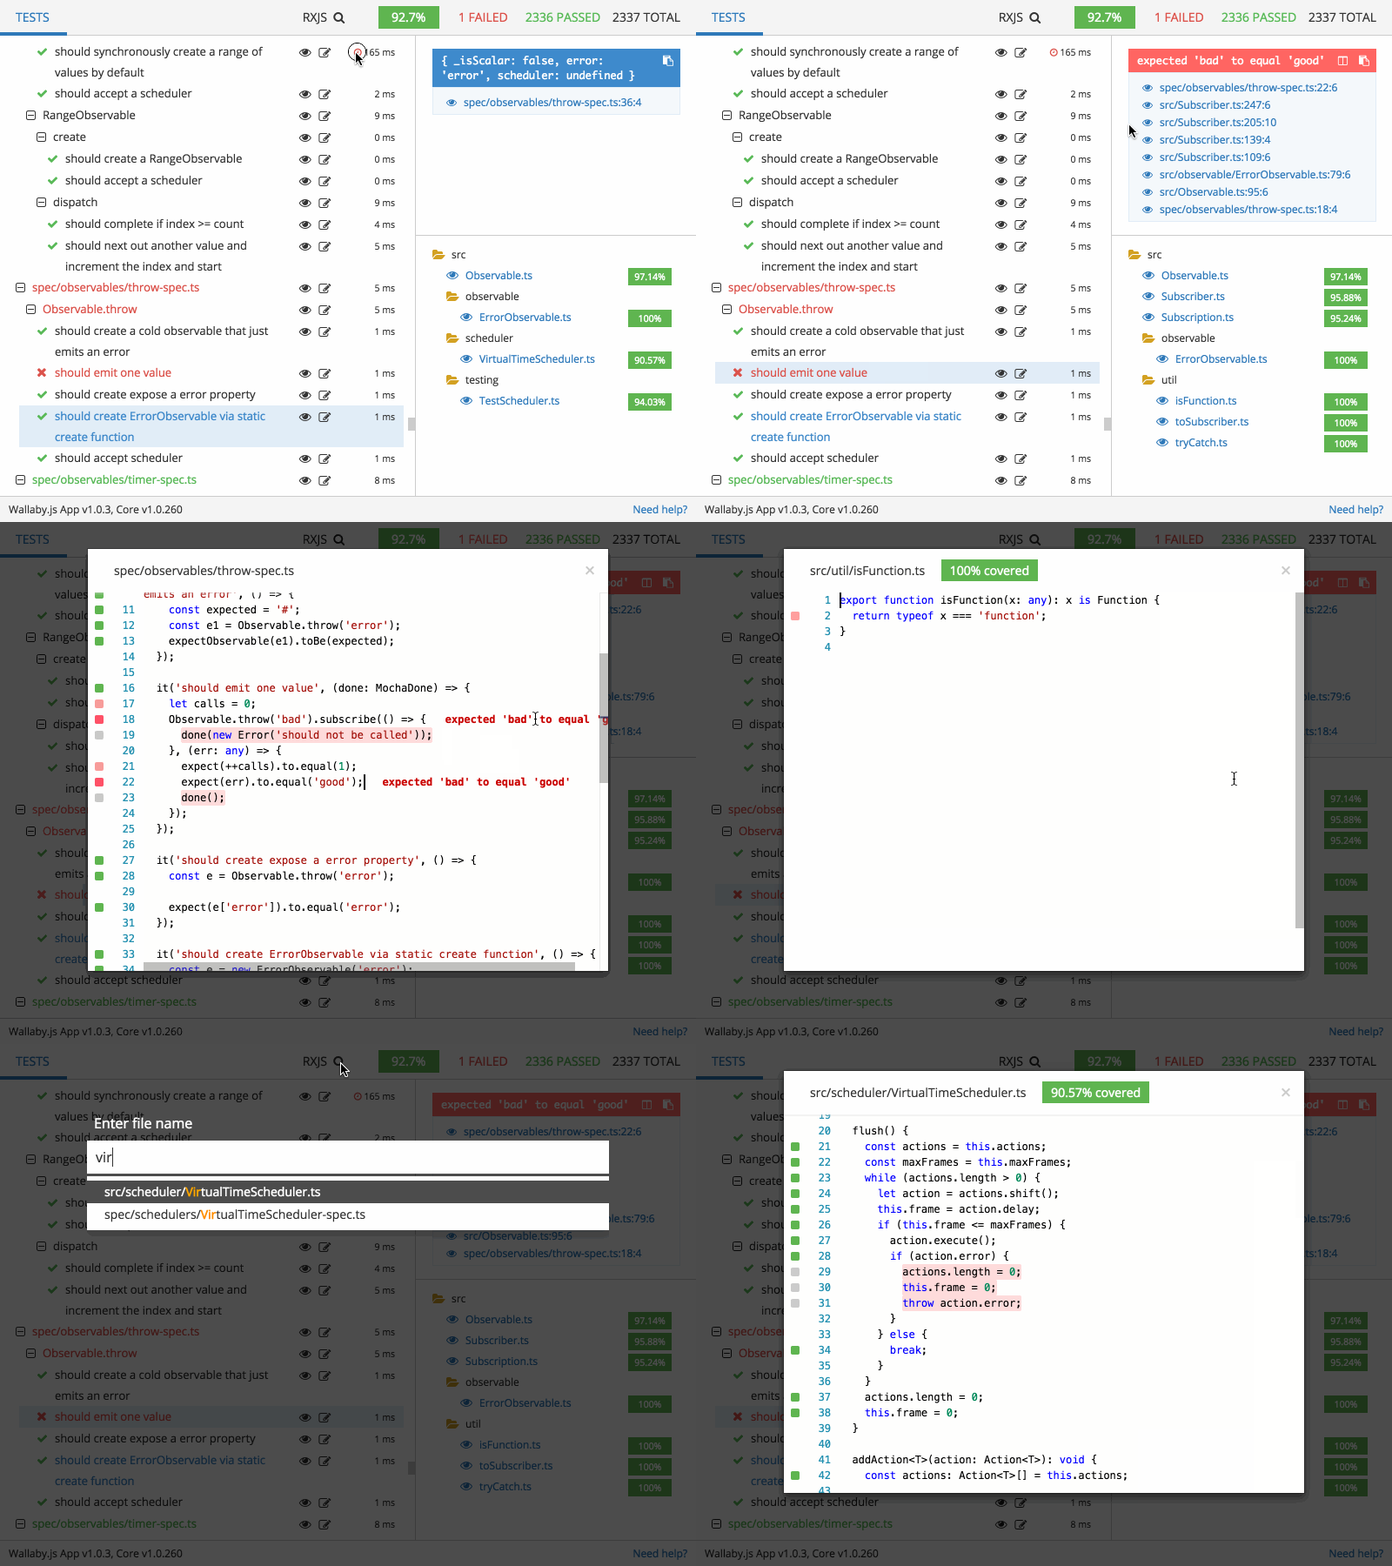
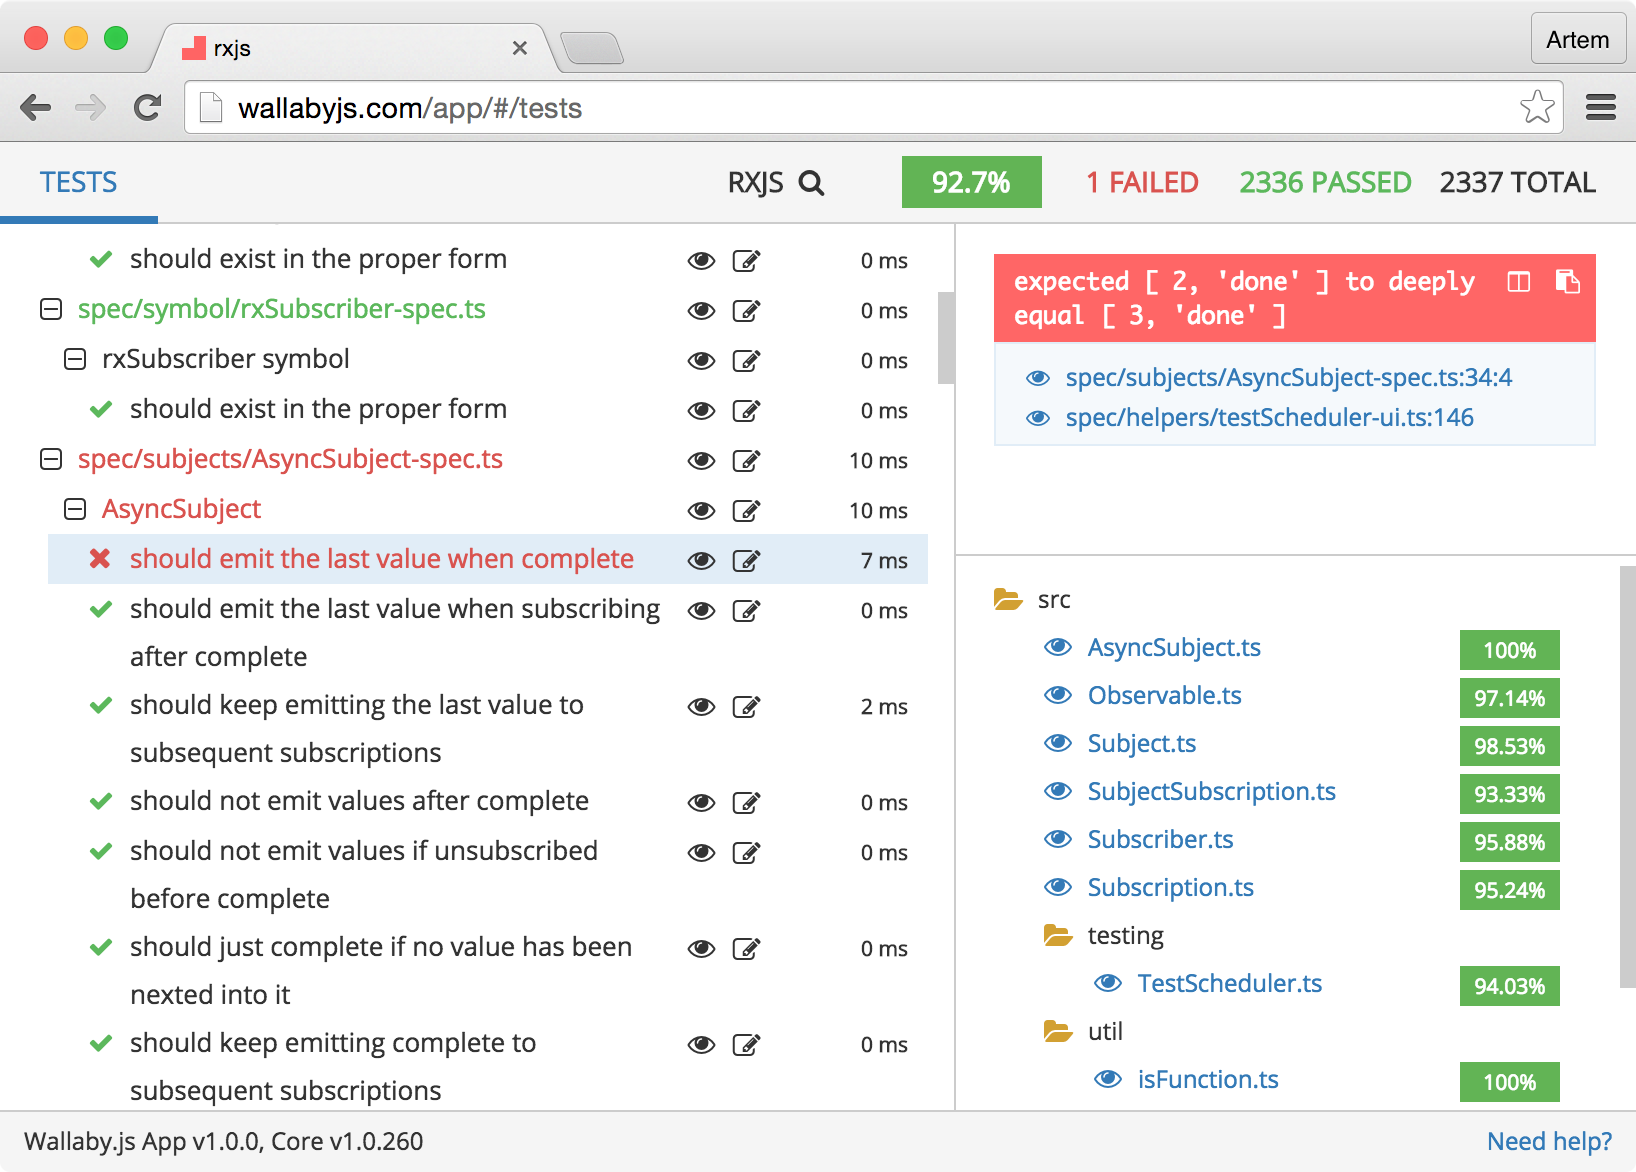
 The Tests view allows you to quickly get tests-centric overview and analytics for your project.
On the left hand side you can see the tree of your project tests. You may navigate it with the keyboard using arrow keys, plus Cmd/Ctrl (Shift) to expand a node or the whole tree. For each tree node you may see the execution time (aggregated for files and test suites) and an indicator if some of the tests are slow. A test is considered as slow if its execution time is greater than a configurable value. With mocha framework, the value can also be overriden by any describe or it using the this.slow function.

Before describing the rest, I’d like to mention that, despite being a strategic level tool, wallaby.js app is not a static report: almost everything gets updated automatically in realtime when you change your code, add or remove files, increase code coverage, etc.
For any file or test displayed anywhere in the app, you may open its location in your editor by clicking the editor icon (or the stack entry/file link), or pressing Cmd/Ctrl + Enter while in the tests tree.
However, sometimes you may not want to leave the app to view the code, for example because you are not planning to change it right now. In this case you may use the eye icon or press Enter for the selected tree node to open the source right inside the wallaby.js app.
As you can see, the displayed file view provides a similar experience that you have in wallaby.js plugin for your editor - you may see the coverage indicators, uncovered code regions and inline error/log messages.
While being able to view some file or a test under your mouse is great, sometimes you may want to open any file of your project. To do this, you may just use the magnifier icon next to the project name in the app header, or press Shift twice, enter the file name and view it.
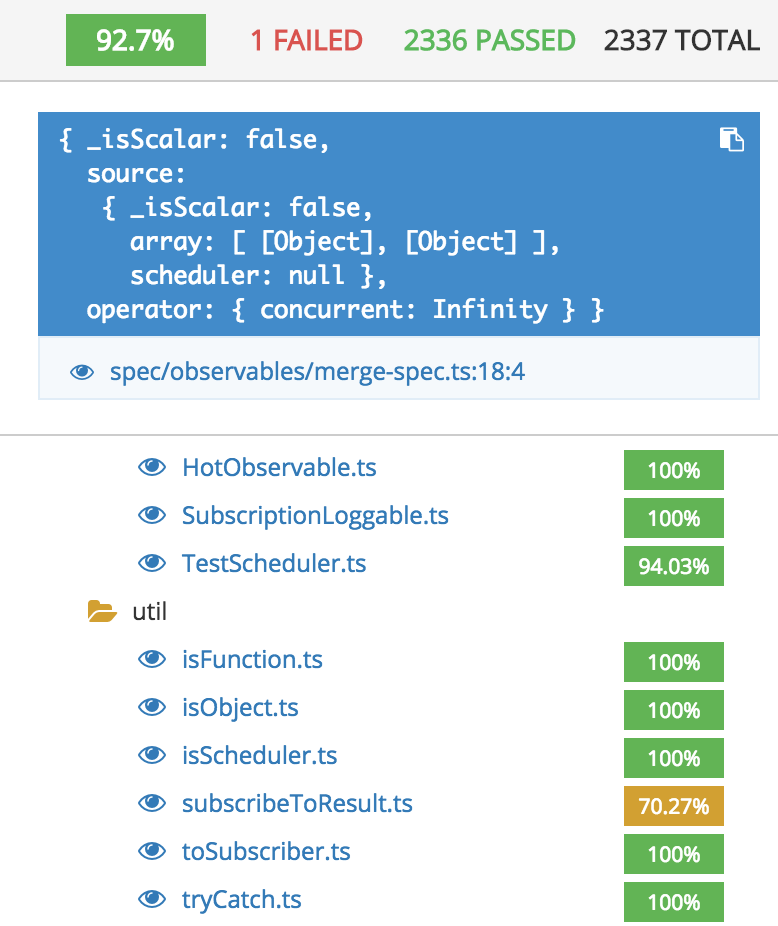
 While in the tests tree, you may select a test or a file to see its details. The details include errors or `console.log` messages logged while executing the test. If you select a test file, you'll see the errors and log messages for all tests in the file.
The details of the selected test or test file also display the tree of the source files that are covered by the test. Each file in the tree contains its current code coverage value. If the value is too low, it is highlighted in yellow.
The overall project code coverage and other project stats are also displayed in the top right corner.
Files
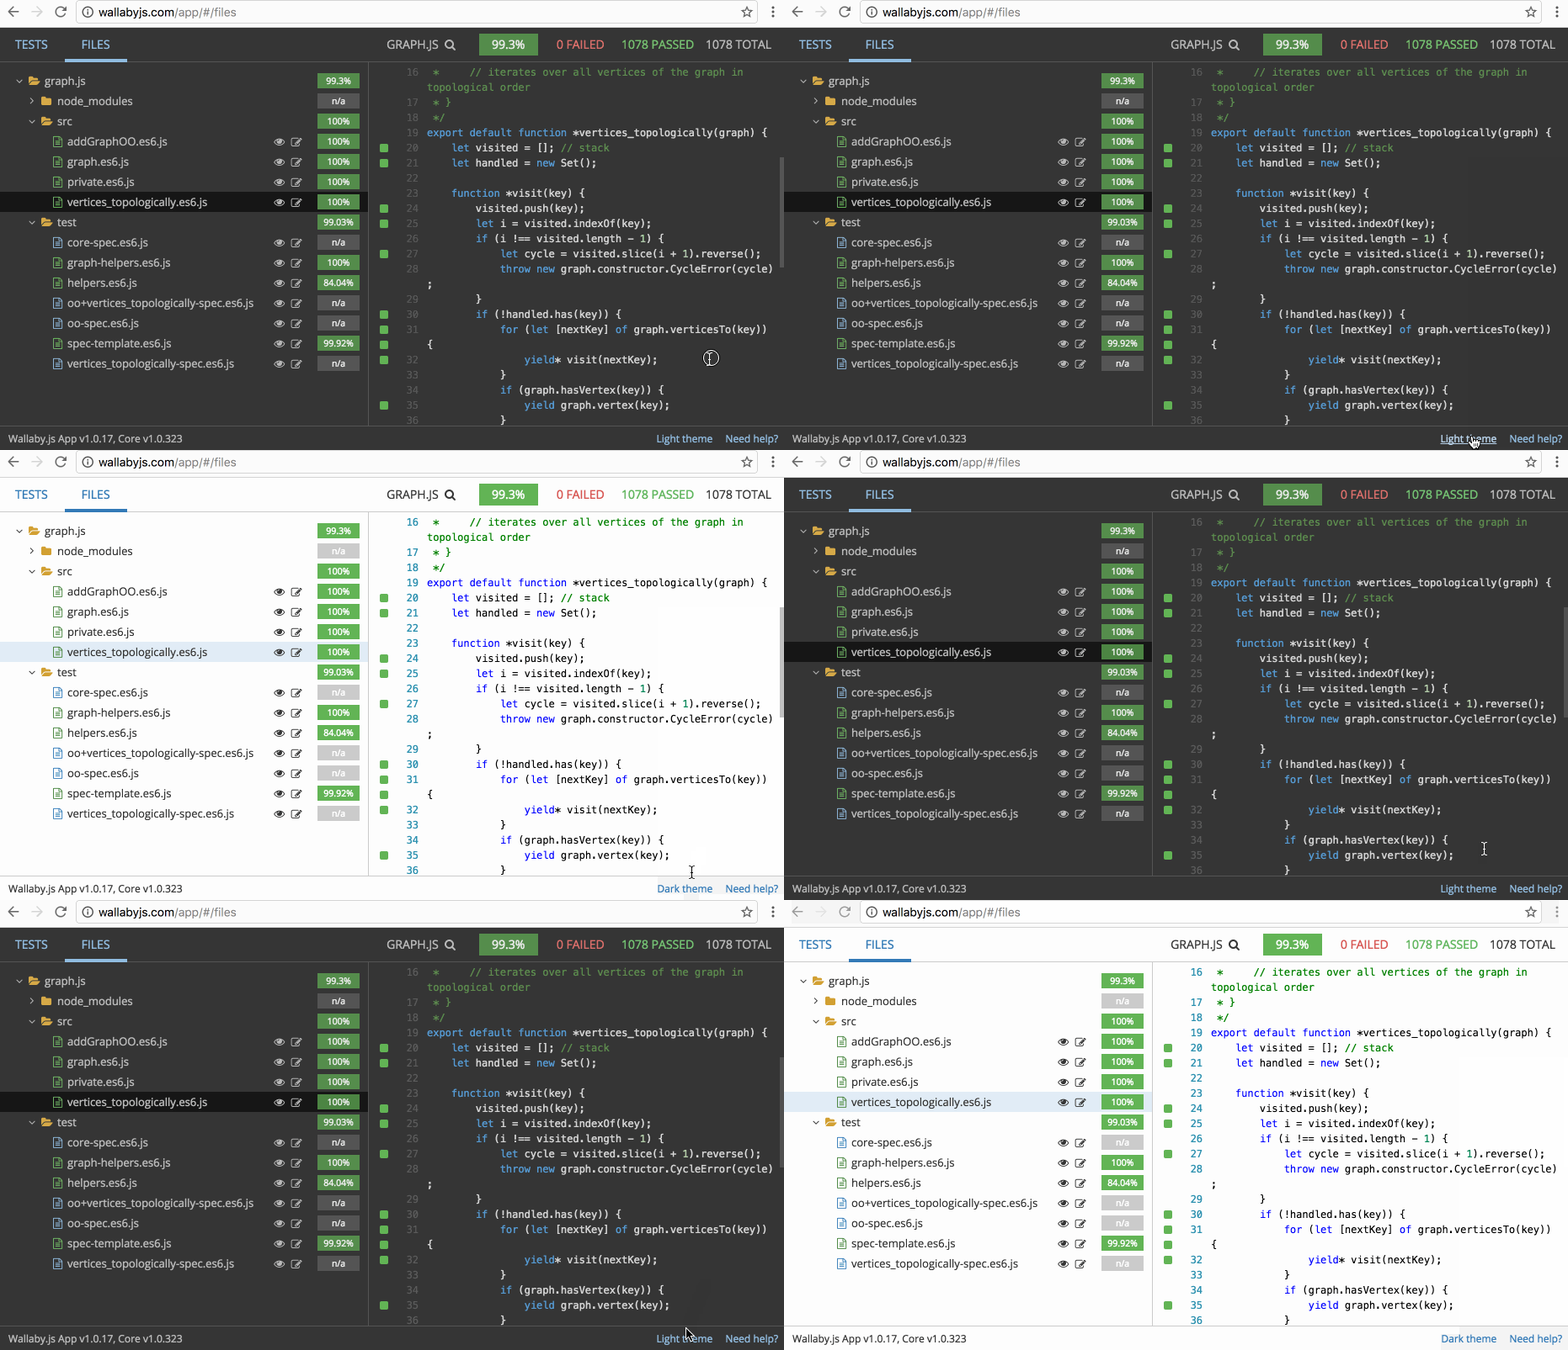
The Files view allows you to quickly get file-centric overview and analytics for your project. The view combines both annotated project file tree and a selected folder/module sortable list of files.
You may select a folder, and you get the full sortable table of all files in the folder and its subfolders (with a relative path where required).
This way you can both browse the tree structure, see the aggregated coverage values, select a folder/module and easily find the least covered files no matter how deep your folder structure is.
You may also select an individual file from the project files tree and see the code coverage inside it.
FAQ
How do I change the displayed name of my project?
  module.exports = function () {

    return {
      name: 'My Project Name',
      ...
    };
  };
How do I change the app theme to “dark”?
 The app theme can be changed to "dark" or "light" by clicking the link in the bottom right corner.
How do I exclude certain files or file patterns from code coverage calculation?
While there’s the instrument flag which can be used to stop some file(s) instrumentation, sometimes you may just need to exclude a file from code coverage calculation, and still be able to see its coverage indicators, inline errors and messages, etc., when the file is opened.
You may use the filesWithNoCoverageCalculated setting in these scenarios. For example, the following config will exclude all files that name ends with -helper.js from code coverage calculation:
  module.exports = function () {

    return {
      ...
      filesWithNoCoverageCalculated: ['src/**/*-helper.js']
    };
  };
How do I exclude certain code blocks or branches from code coverage calculation?
You may use code comment hints to ignore some specific code within a file for coverage purposes.
How do I change the “slow test” criteria?
A test is considered as slow if its execution time is greater than the configurable value.
How do I change the “low coverage” criteria?
A file coverage is considered as low if the value is less than the configurable value.
How do I access Wallaby App if developing remotely?
If you are developing in a remote environment (e.g. using VS Code’s Remote Development Extension) then you need to access Wallaby App using a customized querystring parameter to specify the remote server that is running Wallaby.
To start Wallaby app and specify a remote server, launch with the URL:
http://wallabyjs.com/app/?server={IP address or hostname}
If a remote server is specified then Wallaby App’s status bar will display the server (IP address or hostname) it is connected to and button to reset the setting back to the default (localhost).