Wallaby.js runs your JavaScript tests immediately as you type and displays execution results in your code editor. Wallaby also provides beautiful test and code coverage reports updated in realtime.
In this tutorial we’re going to share how use Wallaby.js in a new Angular CLI project created with Angular’s ng command.
Select your editor
The content of this page is adjusted based on your editor of choice. Please select your editor by clicking on your editor’s logo below before proceeding:
Install Wallaby
First, if you haven’t done so already, go ahead and download and install Wallaby.js.
Create a new project
Now that we’re ready to start, open your terminal and change directory to where we will create our angular app. Run the following command:
npx @angular/cli@latest new wallaby-angular-cli-projectYou will be prompted for two options:
Would you like to add Angular routing?NWhich stylesheet format would you like to use?CSS
At this point, the ng cli tool has created a new folder for us named wallaby-angular-cli-project with our base project.
Start Wallaby.js
At this point, Wallaby.js is ready to be started. If this is the first time you are using wallaby, it may take a minute or two to install all the dependencies it needs.
To start Wallaby in VS Code you may run Select Configuration command and then select Automatic Configuration <project directory> option once. After that you may keep using Wallaby Start command as usual and it will start Wallaby with automatic configuration.
To start Wallaby in Sublime Text you may use the Select for Wallaby.js Automatic Configuration context menu item for your project folder in the project’s file tree. After that you may keep using Wallaby Start command as usual and it will start Wallaby with automatic configuration.
To start Wallaby in Visual Studio, you may use the Start Wallaby.js (Automatic Configuration) context menu item for your project folder in the Solution Explorer. After the first start,
the selected project will be remembered for your solution and Wallaby can be started with Tools->Start Wallaby.js (Alt-W, 1).
To start Wallaby in JetBrains IDEs, you may edit (or create a new) wallaby.js Run Configuration by selecting Edit configurations from the drop-down menu in the top right-hand corner of the navigation bar, or from the Run menu. In the run configuration editor set Configuration Type filed value to Automatic.
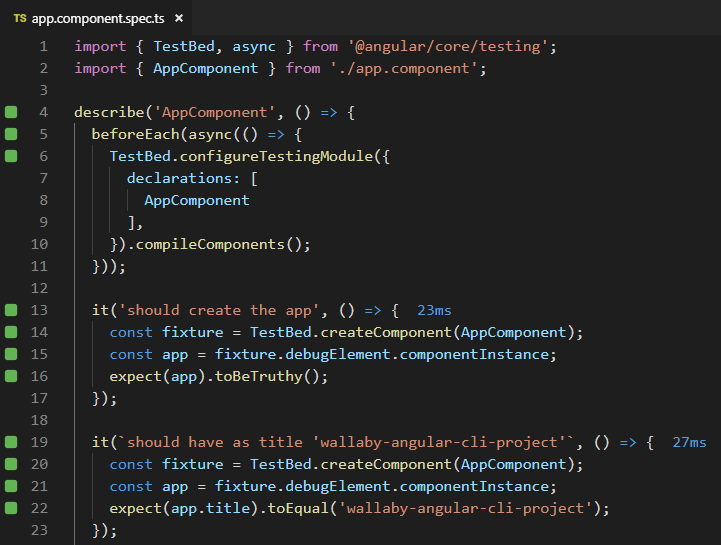
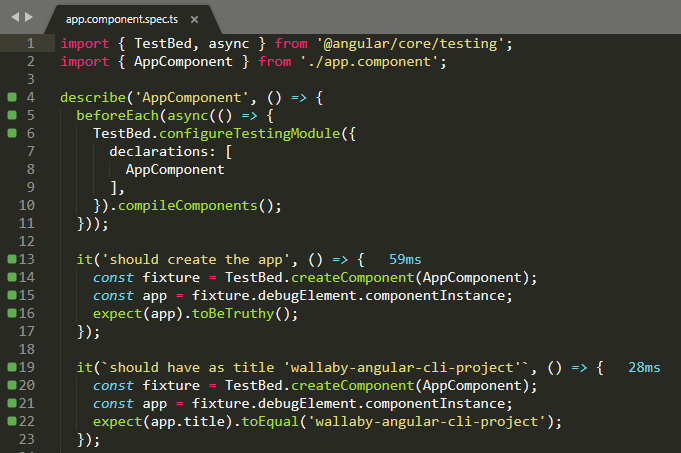
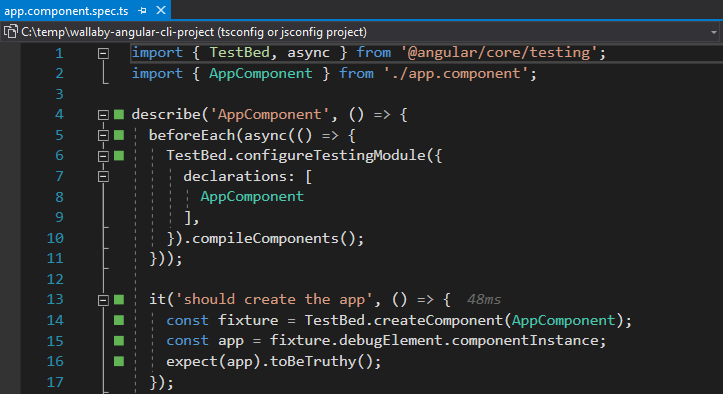
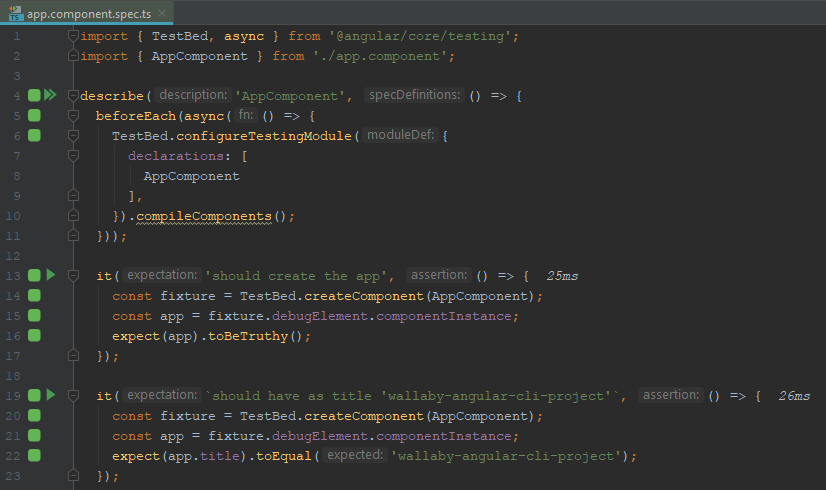
After Wallaby.js has started, navigate to your application and test files (app.component.ts, app.component.spec.ts), you will see coverage indicators in the gutter of your code editor:
- Gray squares mean that the line contains code that was not run by any of your tests.
- Green squares mean that the line contains code that was run by at least one of your tests.
- Yellow squares mean that the line contains code that was only partially covered by your tests.
- Red squares mean that the line is the source of an error, a failed assertion, or is part of a stack trace for an error.
- Pink squares mean that the source line is on the execution path of a failing test.
Open up src/app/app.component.spec.ts to confirm that everything is working. It should look like this:
Break some tests
Let’s break our tests by updating the title property of app.Component.ts.
Open src/app/app.component.ts and change the title from wallaby-angular-cli-project to Wallaby Angular CLI Project.
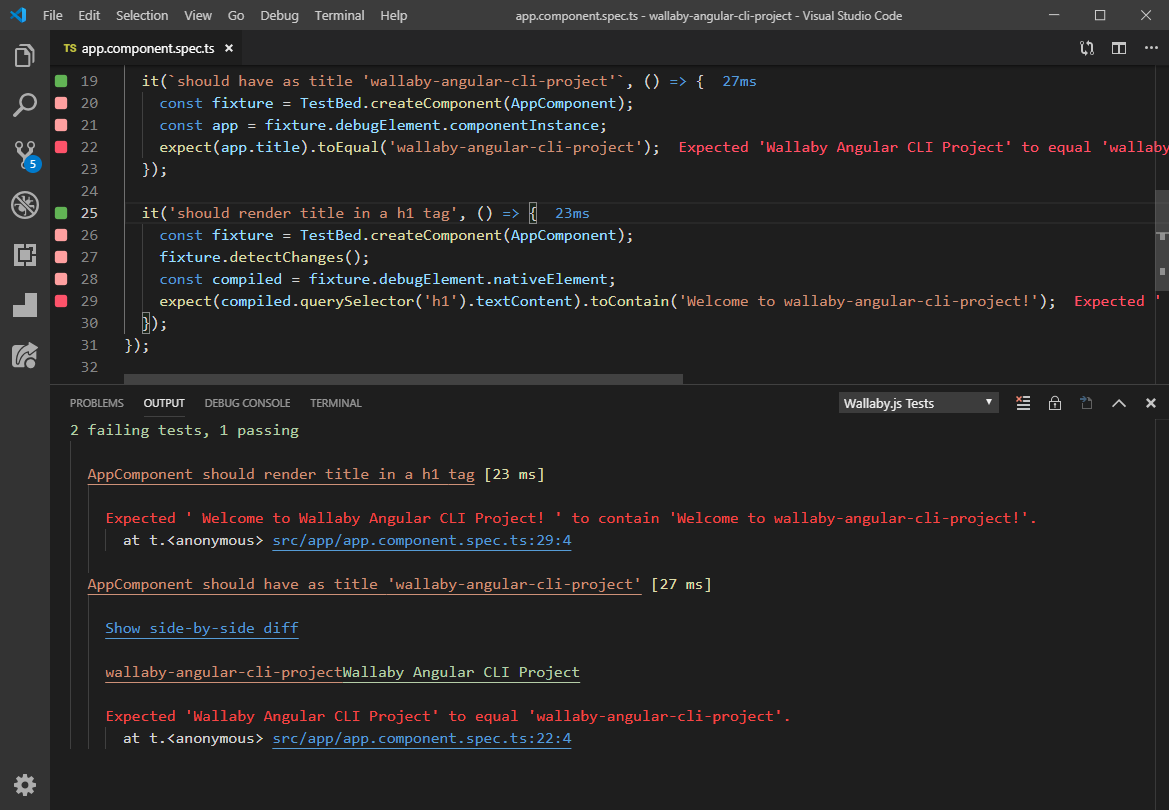
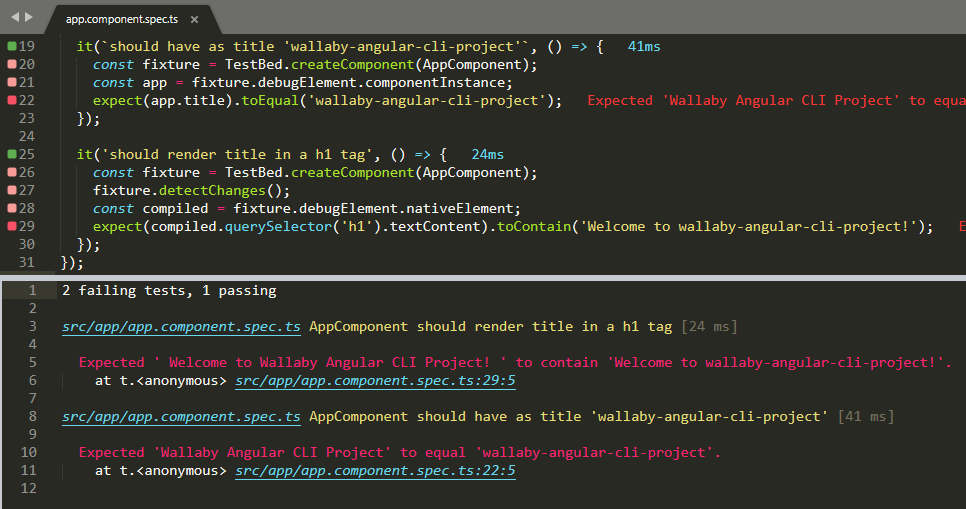
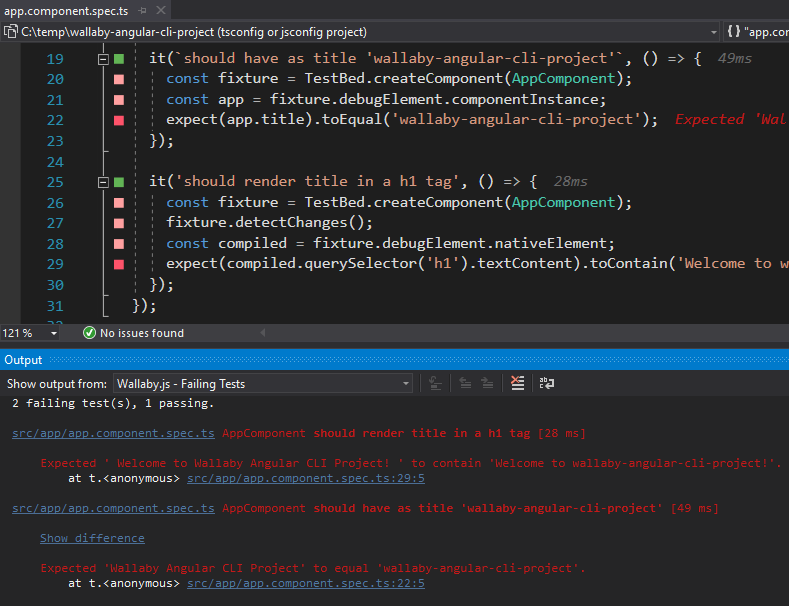
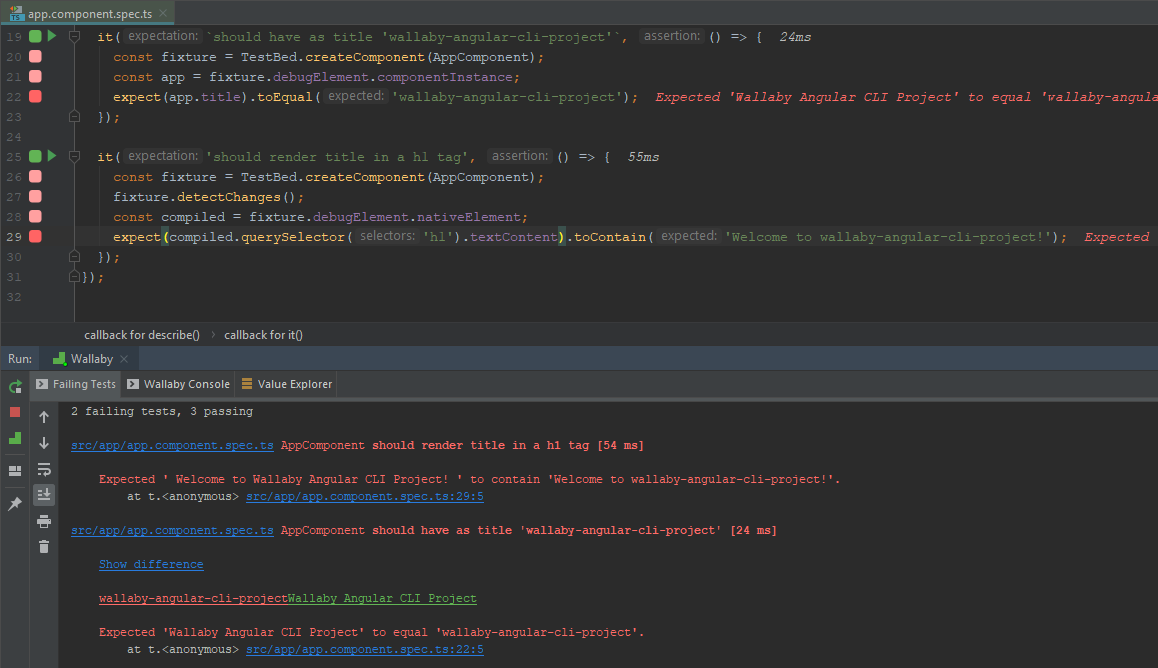
When Wallaby.js is running (as it should be now), you will see that you now have some failing tests.
In src/app/app.component.spec.ts you will see that some line markers have changed to pink,
and your Wallaby.js Test output window shows you that two of your tests no longer equal their expected values.
At this point, you might like to Toggle Wallaby’s Panel by launching the
Command Palette and selecting Wallaby.js: Toggle Tests View.
Fix tests
After reviewing why the tests have broken, we’re happy with the actual values so can go ahead and updated the tests to make them pass. Now do that by updating the expected
values in src/app/app.component.spec.ts.
You’ll see that the error has gone away, and our tests are passing again.
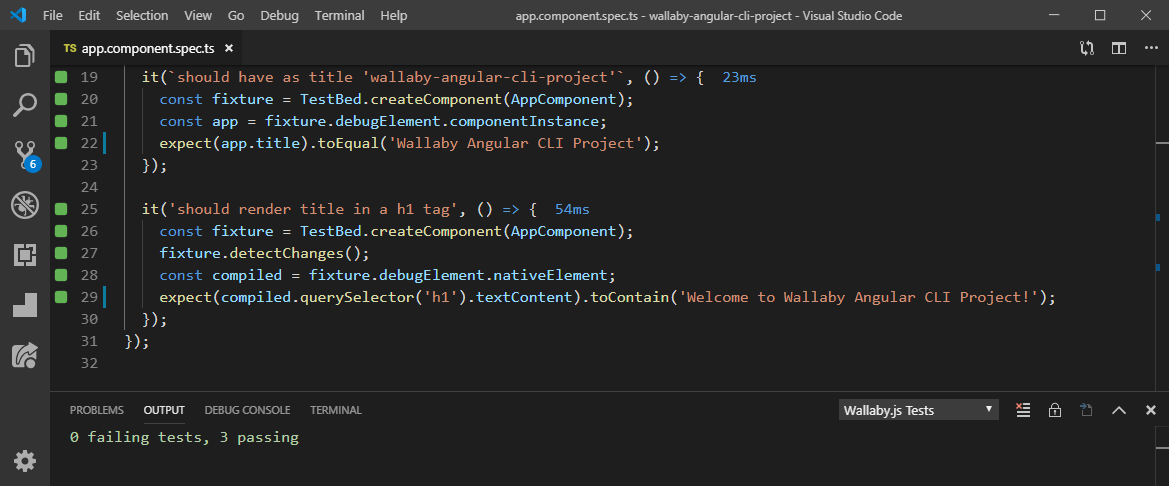
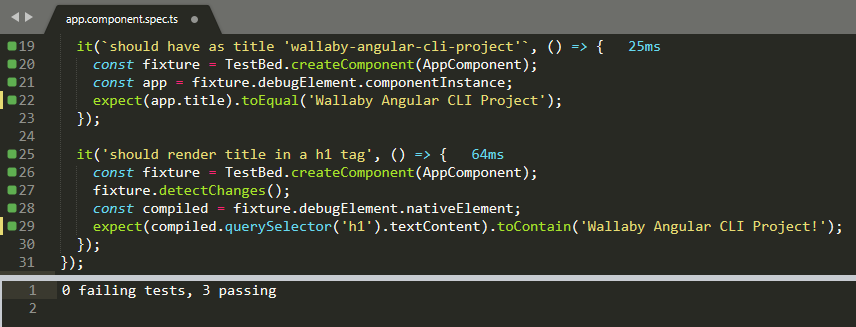
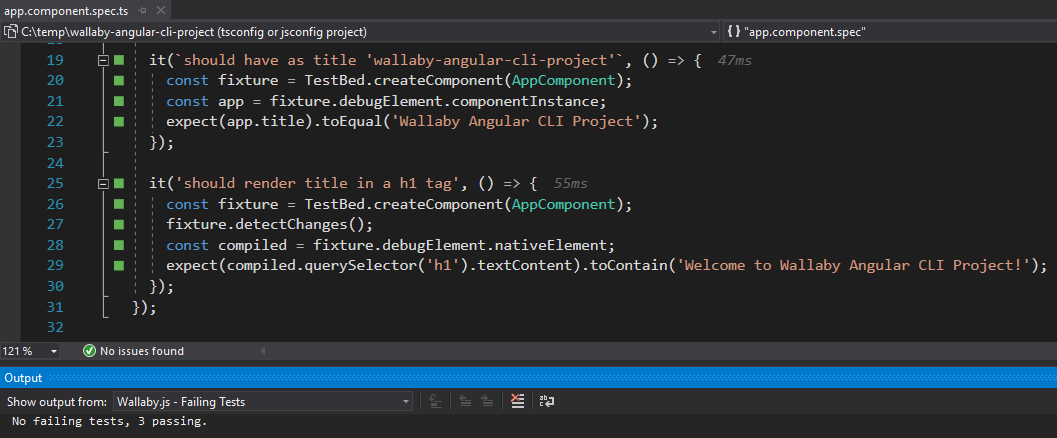
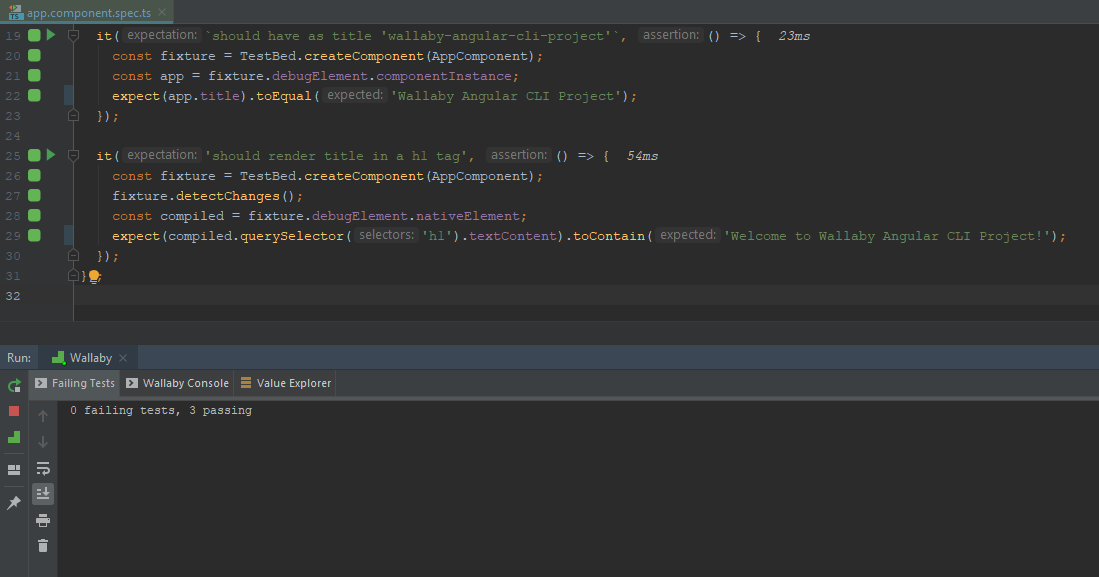
You’re now ready to use Wallaby to write your Angular projects. With Wallaby, you still write your tests the same way that you do today but now you get real-time in-editor feedback.
Debugging a test
Wallaby’s Time Travel Debugger allows you to move forward and backwards through your code to understand the conditions that led to a specific bug. The Time Travel Debugger accelerates your edit, compile and debug loop by allowing you to jump to a specific line of code, view runtime values, edit-and-continue and step into, over and out of your code.
Wallaby’s Time Travel Debugger allows you to move forward and backwards through your code to understand the conditions that led to a specific bug. The Time Travel Debugger accelerates your edit, compile and debug loop by allowing you to jump to a specific line of code, view runtime values, edit-and-continue and step into, over and out of your code.
Once Wallaby has started, the time-travel debugger is available at any time.
The debugger can be started from any of your project’s tests. Navigate to the line of code where your test
starts and run the command, Wallaby.js: Debug Test (Shift + F5).
In addition to being able to start the debugger on the line of code where your test starts, you may also start the debugger on any line of your code that is executed by your tests. When you start the debugger from a line other than the start of your test, the debugger will start and automatically progress to that line. If you start the debugger from a line of code that is covered by multiple tests, you will be prompted to select which test you want to debug.
Wallaby’s Test Story Viewer provides a unique and highly efficient way of debugging your code and inspecting what code your test is executing in a single logical view. The view is integrated with Wallaby’s Time Travel Debugger and Value Explorer.
Learn More…
We’ve only covered the very basics of configuring and using Wallaby.js but the tool is capable of a whole lot more. Read through our docs to learn more about Wallaby.js features. Some notable features include:
- Wallaby App updates in real-time and provides a strategic level view of coverage and test results.
- Advanced Logging allows you to quickly and easily debug at runtime with keyboard shortcuts, comments, and console log.
- Value Explorer provides the ability to explore runtime values right in your editor.
You may also learn about more Wallaby features in the VS Code tutorialJetBrains IDEs tutorialVisual Studio tutorialSublime Text tutorial.
More information about Angular CLI integration can be found here.
Jest
If you have configured your project to use Angular Jest Builder or are using an Nx/Nrwl workspace, you can use Wallaby without any configuration.
If you have a custom configuration Angular/Jest configuration then please refer to our Jest docs.
Troubleshooting
If you get stuck or something isn’t working for you, you may find a similar solved issue in our github issues repository. If you can’t find a solution, create a new issue.