What's New (Page 4 of 11)
Wallaby for VS Code and JetBrains editors now supports Value Peek, a way to quickly see any value just by hovering over it. Wallaby will handle execution of the relevant tests to provide values, which will be displayed in the hover. To keep your editor clutter-free, values shown this way will not appear next to your code by default (but can be made to appear using the “Explore Value” action available in the hover). Value Peek can be toggled on or off to fit with your workflow.
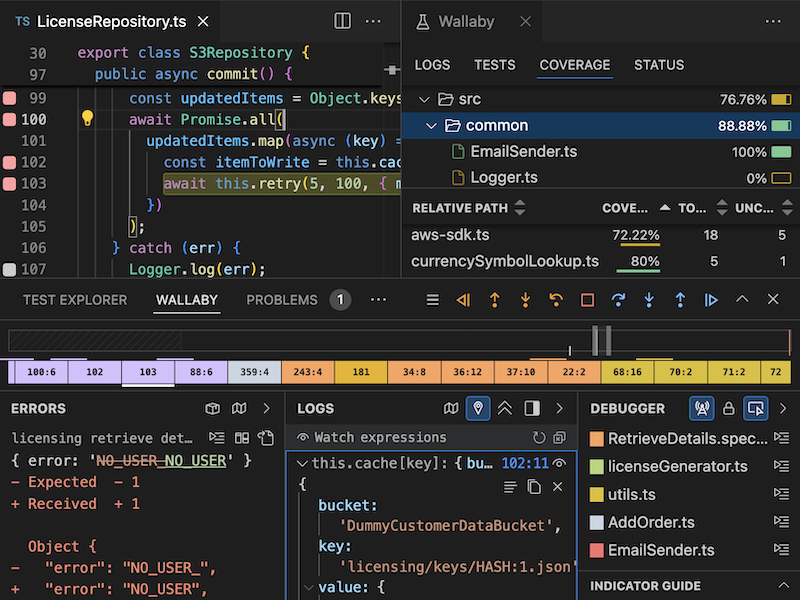
We’ve re-imagined Wallaby.js to deliver more power, flexibility, and a seamless experience across all editors. Wallaby v2 introduces an all-new UI, enhanced debugging tools like the Interactive Time Travel Debugger, and advanced test execution monitoring. With Linked and Standalone modes, it supports any editor, making it easier than ever to streamline your workflow. Read more in our blog.

Wallaby has been updated to support the latest version of vitest, v2.1.0. This update was necessary due to breaking changes introduced in the latest vitest release.

Wallaby now supports the latest version of vitest (v2.0.5). The recent update of vitest included breaking changes that required updates to Wallaby’s vitest integration.

Wallaby now provides experimental support for the node native testing module, node:test (detailed in
our docs). You can now use Wallaby with projects that use node:test, starting
from Node v22.3.0 or higher. As this is an experimental feature, we anticipate there might be edge cases or unique
configurations that could cause issues. We encourage you to
report any issues or provide feedback so we can improve this
integration.
Wallaby now supports the latest version of vitest (v2.0.0). The recent update of vitest included breaking changes that required updates to Wallaby’s vitest integration.

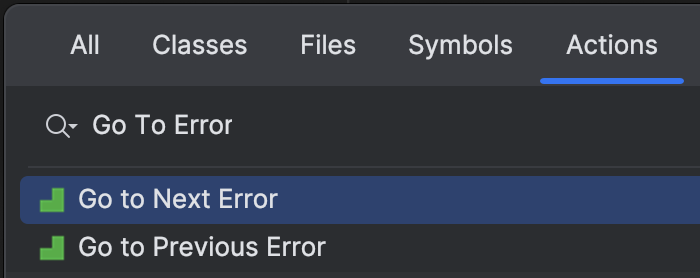
Wallaby for JetBrains editors provides two additional actions, Go to Next Error and Go to Previous Error, allowing you to quickly navigate between errors in your tests. This same functionality was already available in VS Code with the VS Code built-in Go to Next Problem and Go to Previous Problem actions.

Wallaby now supports the latest version of vitest (v1.6.0). The recent update of vitest included breaking changes that required updates to Wallaby’s vitest integration.

The latest version of Jest (v30.0.0-alpha.3) is now supported by Wallaby. This version included a number of breaking changes that required updates to Wallaby’s Jest integration.

The latest version of Wallaby significant improves performance startup and test execution times for Jest projects; Jest’s TypeScript configuration files are now transpiled using swc instead of ts-node, and large mono-repos only load project configuration on demand. For large projects, test execution times can be up to 90% faster than before.
