First you need to install wallaby.js package for Atom, if you haven’t done it yet.
For this tutorial we will use our sample calculator project. You may download a zip file with the source code or else clone the repo using:
git clone https://github.com/wallabyjs/calculator-sample.gitOnce you have the source code locally, open the project folder in Atom.
First steps
Configuring Wallaby
Wallaby for Atom needs to know what configuration is required to run your tests. If you are using a technology that is supported by
automatic configuration, then you may use the Select for Wallaby.js Automatic Configuration context
menu item for your project folder in the project’s file tree. After that you may use the Wallaby Start command and
Wallaby will remember that you are using automatic configuration. If you have a mono-repo and only want to run for one project,
you may use the Select for Wallaby.js Automatic Configuration context menu item for the project folder.
If your project does not support automatic configuration then Wallaby will automatically search for a configuration file
in your project root and will automatically select it, valid names are: wallaby.js, wallaby.conf.js. If you have multiple
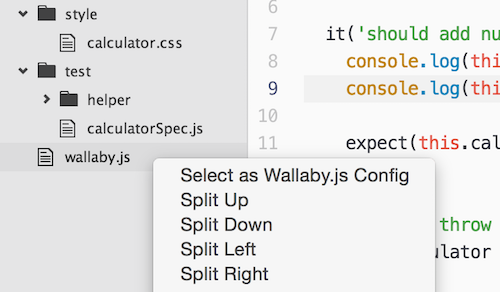
configuration files, use different naming convention or have the config file not in the root folder, you may select the config file
from the Tree View with context menu or by opening the config in an editor tab and using Select as Wallaby.js Config context menu item.
Wallaby.js Command Palette
As you probably know, you may press Ctrl/Cmd + Shift + P in Atom to get the editor Command Palette in case if you’ve forgotten some shortcuts or just like invoking commands this way. There you may search for wallaby and use the found commands.
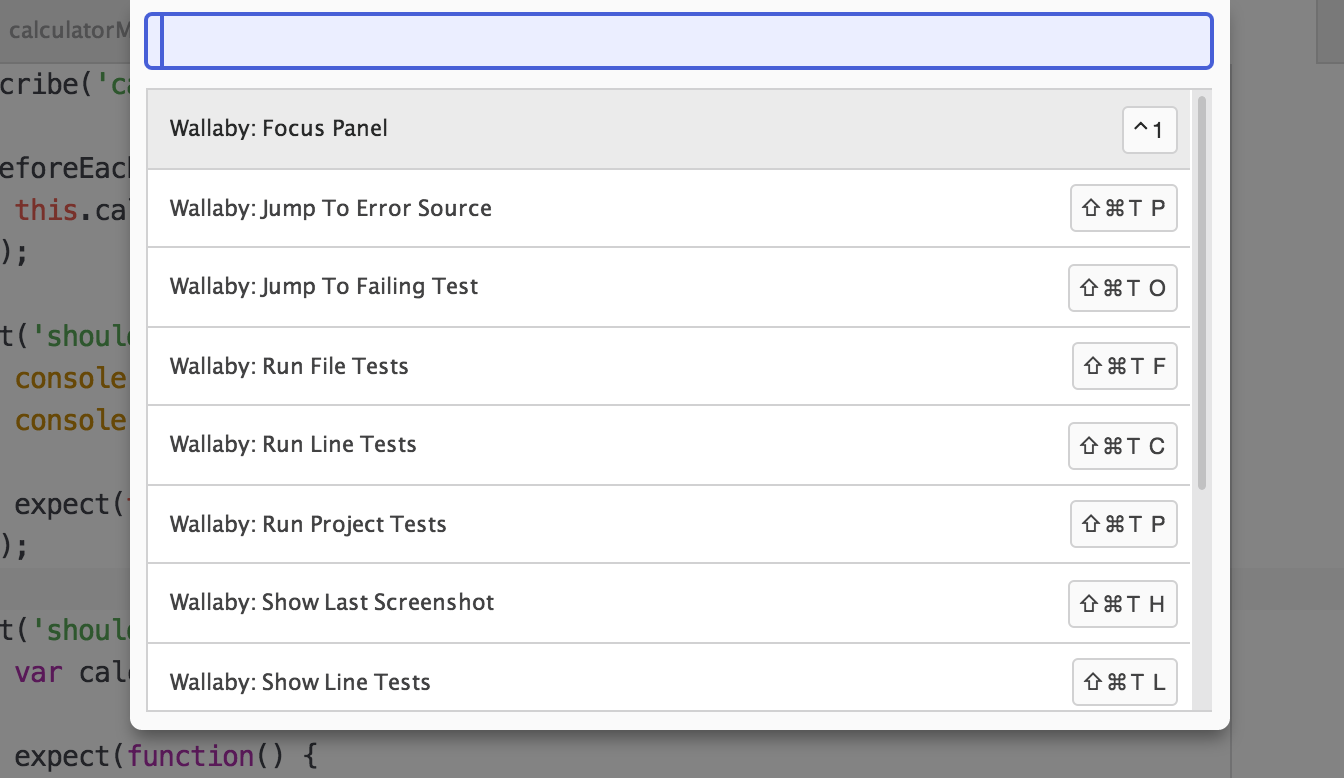
Also, for your convenience wallaby.js adds its own Command Palette to Atom that you may display by pressing Ctrl/Cmd + Shift + Space. It’s a fast and easy way to quickly use various wallaby features.
Wallaby.js Panel
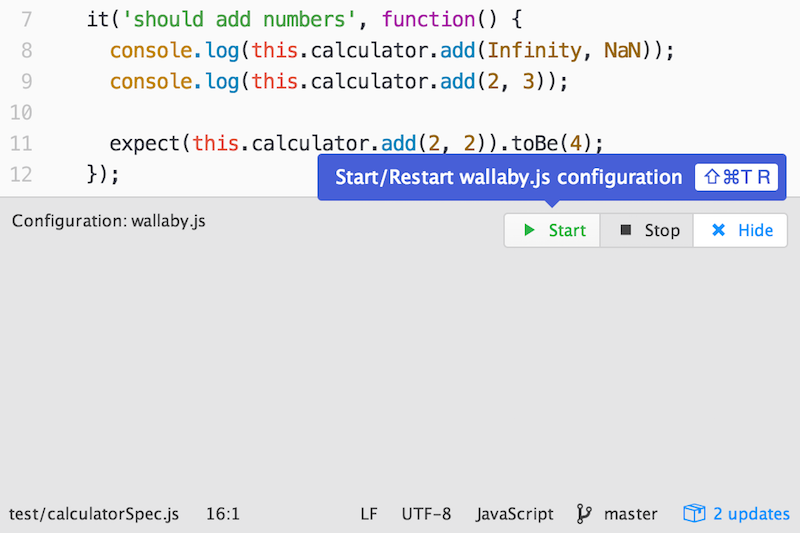
One of the things you’ll be using a lot is wallaby.js Panel. It displays the name of the selected config file, failing test results as well as some test stats. You can open and collapse it by using the corresponding command (from the palette or via Ctrl/Cmd + Shift + T, T shortcut).
Let’s try starting wallaby.js: to do that you need to invoke wallaby Start command. You may do it by using the Ctrl/Cmd + Shift + T, R shortcut, or using wallaby Command Palette, or by clicking Start button on the wallaby.js Panel.
To stop wallaby.js, you may use Stop command or Stop button on the wallaby.js Panel.
Now let’s have some fun.
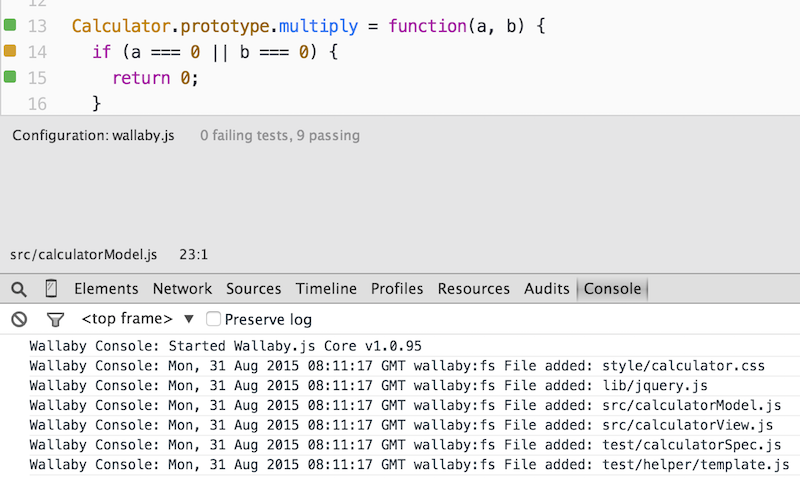
Wallaby.js in action
Once you have started wallaby.js, at the bottom right corner of the editor you’ll see wallaby status indicator. It’s job is pretty simple: when it displays a spinner - your tests are running, when it’s red - you have some failing tests, when it’s green - all of your tests are passing. You may also use the indicator to toggle wallaby.js Panel by clicking it.

Now, let’s open the sample calculator project spec (test/calculatorSpec.js).
When wallaby.js is running, you can see the code coverage in opened source files (specified in wallaby configuration file). As you can see, there are various colored squares displayed for each line of your source code.
Try jumping to any of the passing tests and break it, for example try changing the 2 plus 2 expectation result to 5 in the should add numbers test, or try breaking the code covered by the test. Right after the change wallaby.js automatically runs your tests and displays the result in Atom, right where you need to see it.
The code coverage and inline messages are automatically updated, just as you type.
Also, try editing some console.log arguments or just console.log any object you like.
This is a great way to quickly inspect any objects without having to leave your editor, without switching to any other console. Think how cool it is - your code editor is your console with all the required context.
We also recommend reading about some more powerful ways to log things and measure code performance with wallaby.js.
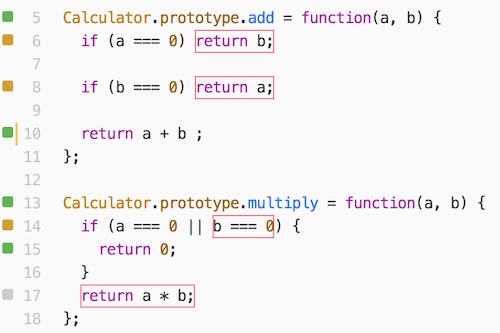
Coverage indicators
Let’s have a look at the editor gutter where you may see some indicators. Here is what these coverage indicators mean:
- Gray squares mean that the source line is not covered by any of your tests.
- Green squares mean that the source line is covered by at least one of your tests.
- Yellow squares mean that the source line is only partially covered by some of your tests.
- Red squares mean that the source line is the source of an error or failed expectation, or is in the stack of an error.
- Pink squares mean that the source line is on the execution path of a failing test.
Any indicator click triggers Show line tests command which we will review later.
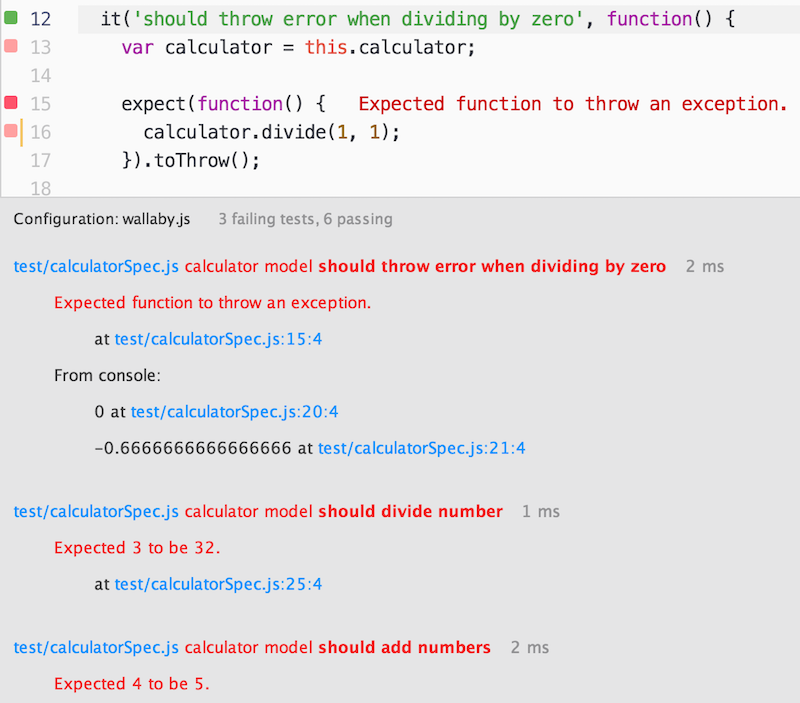
Failing tests
Wallaby.js Panel displays all tests that are currently failing along with the error stacks and registered console.log calls. Some bits of the displayed information are hyperlinks that you can use with your mouse or keyboard (Enter) to navigate to different places, for example to the exact error line, or a failing test, or a place where something is logged to console. To quickly focus the panel you may use the Focus Panel wallaby command (Ctrl + 1), pressing Esc will return the focus back to the editor.
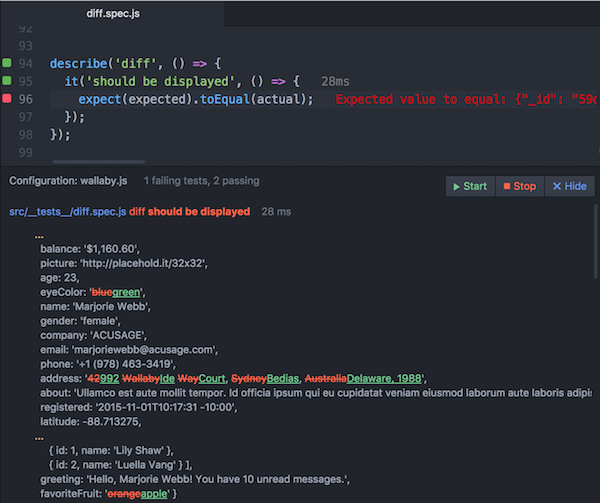
Diff views
When a test error contains expected and actual properties, wallaby displays compact diff view. This allows to quickly debug failing equality assertions and snapshots.
Test focusing
Sometimes when writing or debugging a test, set of tests or test file for a particular feature, you may need to execute this specific test, set of tests or test file and see code coverage and output only for the specified scope.
Wallaby fully supports testing frameworks test focusing functions such as it.only, as well as special comments to focus/skip specific test files.
Test filtering
Test Filtering allows you to limit the display of coverage indicators, console messages, live comment messages and errors messages to only the tests that you are working on instead of all tests in your project.
You may notice that Test Focusing covers filtering, but there are two key differences between them:
- The
Test Filteringin contrast to theTest Focusingdoes not re-execute your tests when applying/clearing the filter. When you change from only running selected test(s) to running all tests in your project, all tests are re-run; theTest Filteringdoes not re-run any tests when the filter is set or cleared. - The
Test Filteringfeature does not actually change Wallaby’s run-time behavior (after any code change, the minimum set of affected tests will be re-run). In contrast, theTest Focusingfeature may enable a more efficient workflow for large repositories with many test files, or for slower tests, as Wallaby will only process/run the selected tests.
To add and remove tests from to/from the test filter or clear the test filter you should use the Toggle Test Filter command. The command acts differently depending on whether the editor cursor is:
- on a test declaration line or within a test and the test is not filtered:
test will be added to filtered tests - on a test declaration line or within a test and the test is filtered:
test will be removed from filtered tests - in a test file but outside of any tests:
each test within the file's filter state will be toggled - in a non-test file:
test filter will be reset
You may also clear the test filter by executing the Reset Test Filter command.
In addition to this, Wallaby App supports granular test filter management with full editor synchronization.
Commands
To help you writing/navigating your code and tests more efficiently, wallaby.js provides a few commands. You may see the full list in the wallaby.js Command Palette (Ctrl/Cmd + Shift + Space).
These commands include:
- Show Line Tests: displays the line related test data. The command allows you to quickly view all tests (both failing and passing) that cover the current line of code, navigate to test and code errors, view console messages related to some specific test or some source code line.
- Jump To Failing Test: allows to quickly navigate to the failing test from any ‘pink’ context (the failing test execution path).
- Jump To Error Source: allows to quickly navigate to the source of the test error from any ‘pink’ context (failing test execution path).
- Toggle Uncovered Regions: displays/hides uncovered regions for an opened file. The command is very useful for ‘yellow’ lines to display what is exactly not covered in the line. Highlighted markers will automatically disappear when you start editing your code.
- Run Line Tests: the command is pretty simple, it just runs a single test (if invoked from within the test) or all related tests (if invoked within some source code covered by the tests).
- Run File Tests: the command runs all tests within the test file it is invoked in, or all tests in all the test files that cover the source file that the command is invoked within.
- Run Project Tests: the command runs all tests in your project.
- Toggle Test Filter: adds/removes a test to/from the test filter or clears the test filter. When the test filter is set, the command shows coverage indicators, console messages, live comments messages and errors messages only for the selected tests. When the filter is cleared, the command shows coverage indicators, console messages, live comments messages and errors messages for all tests.
- Make Current Session Run On Any Change: the command makes your current Wallaby session start a test run when code is changed in your editor or when code is saved on disk.
- Make Current Session Run Only On Save: the command makes your current Wallaby session start a test run ONLY when code is saved on disk.
- Toggle Current Session Run Mode: the command toggles between Make Current Session Run On Any Change and Make Current Session Run Only On Save.
Troubleshooting
If you encounter any issues with configuring or using wallaby.js and are not sure why it happens, check out our troubleshooting docs section or search our public repository issues to see if someone else has experienced something similar.
Another useful technique is to run wallaby.js with the trace flag set to true. In this case wallaby outputs a lot of additional information about the test execution progress which may help you to understand what’s going on if something goes wrong. The output can be viewed in the Developer Tools Console (Ctrl/Cmd + Alt + I).
Trial version
Wallaby is installed with a limited-time feature-complete demo license that periodically prompts you to restart your editor to continue using the tool. Free Trial licenses that allow you to evaluate without prompts and restarts are also available.