Quick Start
If you are the type of person who likes to start exploring a product with minimal training vs. a guided tutorial experience, you may watch the quick start slides below and start using Wallaby straight away.
We strongly recommend completing the tutorial below at some point in time, as it covers Wallaby’s very powerful feature set and will take advantage of all that Wallaby has to offer.
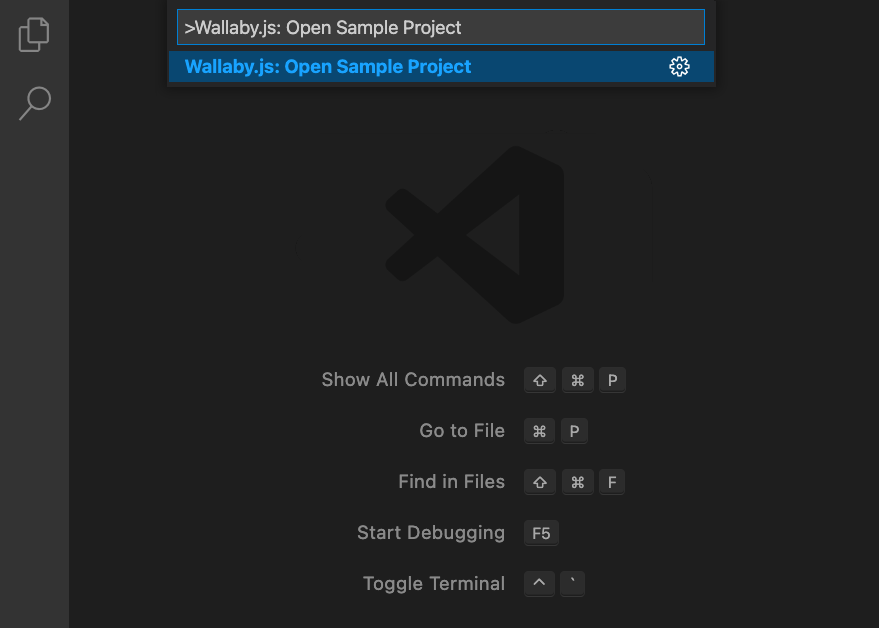
Run the
Wallaby.js: Open Sample Project
command
See inline messages and errors
See code coverage indicators
Start the time-travel debugger with the Debug code lens
Explore other Wallaby features
About the Tutorial
Welcome to the Wallaby VS Code interactive tutorial. The tutorial is suitable for new users, and existing users who want to learn how to use new features as they are released.
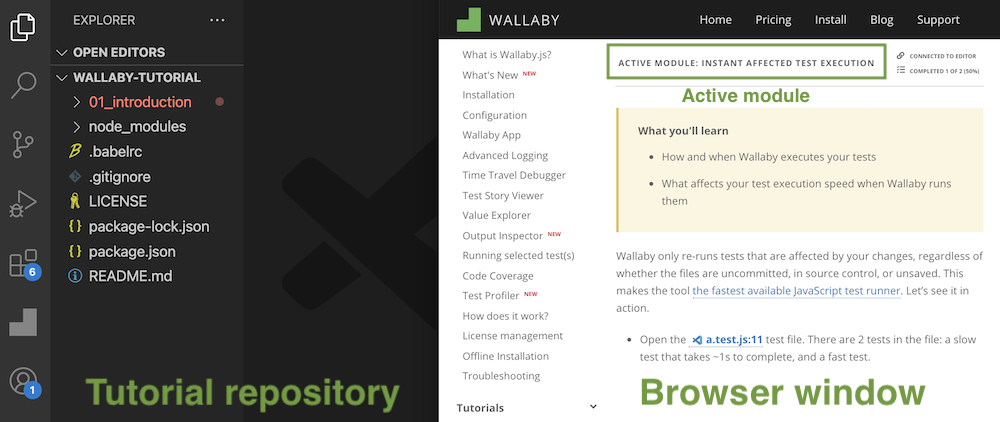
The tutorial is supposed to be opened by running the Wallaby.js: Open Tutorial command (or using the links on the Wallaby Welcome VS Code page). The command downloads and opens a GitHub repository with code examples for the tutorial. We recommend positioning the VS Code window with the opened tutorial repository side-by-side with the tutorial browser window for the best user experience.
Alternatively, you may follow the tutorial without having VS Code opened, however in this case you will not be able to open source files or save your learning progress.
If the tutorial cannot connect to VS Code because it's not running, or if the tutorial page disconnects from VS Code for some reason, you will see the Not connected to editor label at the right side of the tutorial header. In this case you may try running the Wallaby.js: Open Tutorial command in your editor to restore the connection. If this does not help, please try using Chrome in case your browser is blocking the localhost web socket connection that Wallaby uses to synchronize VS Code with the tutorial page.
The tutorial consists of several modules that cover specific Wallaby features.
Some modules can be started in your opened VS Code instance right from the tutorial page using VS Code icon in the module’s header. Starting the module makes Wallaby run the module’s tests and code in your editor. The currently started module’s name is displayed in the tutorial’s sticky header with the Active module label.
Once a tutorial module has been started in VS Code, you may start following the module's content. In the module you may see links decorated with VS Code icon, clicking such links opens related files in VS Code. For example click to open the README file.
If you make any undesired changes while following a module, or something stops working for you, you may use the Restart module icon located next to the module’s header.
Inside a typical module you will find instructions to follow, feature guides, color-code sections with self-descriptive headers, and helpful images and videos.
Once you finish following a module, it can be marked as Completed using a corresponding checkbox at the end of each module and next to the module’s header. After a module has been marked as completed, the completion progress is saved locally.
When significant changes or additions are made to the module after it has been marked as completed, the module gets automatically marked as Not Completed and new/modified parts are marked with the right border. The current paragraph is marked with the border as an example.
After at least one module is marked as completed, modules that have not yet been completed, or modules that contain modified content are marked with the same color in the Tutorial Modules list on the right side of the screen.
- You can use links marked with the VS Code icon to open files in your running VS Code instance.
- You can use the
Restartbutton to revert any undesired changes to the tutorial source code. - You can mark a module as
Completedto allow you to easily see future changes and additions to the tutorial.
Introduction
- What is Wallaby
- How to configure Wallaby (if required)
- How to start using Wallaby
Before you start, there are a couple of things that you are expected to know in order to get the most out of this tutorial: the basics of unit testing and experience with any testing framework (understanding what is a test file, a test, a test assertion). If you do not understand these concepts, we recommend taking one of the many available courses first.
What is Wallaby
Wallaby.js is an integrated continuous testing tool for JavaScript. Unlike other test runners, Wallaby provides feedback directly in your editor, right next to your code. Wallaby is insanely fast because it calculates and runs only the minimum set of tests affected by your code changes. A lot of the time, this means only a single test needs to be run. Wallaby runs your tests immediately as you type, even on unsaved files. With Wallaby, you don’t have to wait until later to find out that your code changes have broken your project. Wallaby works well, even on very large projects and includes features that allow you to focus on a specific test or set of tests so that your workflow scales, no matter how large your project becomes.
Wallaby provides the following features (fully covered in this tutorial)
- realtime feedback for errors and any expressions in your code,
- realtime code coverage updated as you type,
- time travel debugger with edit-and-continue,
- value explorer and output inspector for viewing runtime values,
- running and focussing on selected tests,
- quick navigation to failing tests/error sources,
- close to instant incremental test execution,
- code coverage explorer and test explorer,
- compact & side-by-side diff views, and much more
Here is a tiny quick glimpse of what working with Wallaby looks like:
How to configure Wallaby (if required)
For many popular testing environments (jest v24+, Angular CLI v8.2+, Vue CLI v4+, Create-React-App v3+, and NX Workspaces v8+) you can start Wallaby without any configuration.
For other supported testing frameworks a simple configuration file is required. Overriding default automatic configuration settings is also supported.
How to start using Wallaby
For the tutorial, Wallaby has already been started for you on a sample tutorial repository using jest as the testing framework.
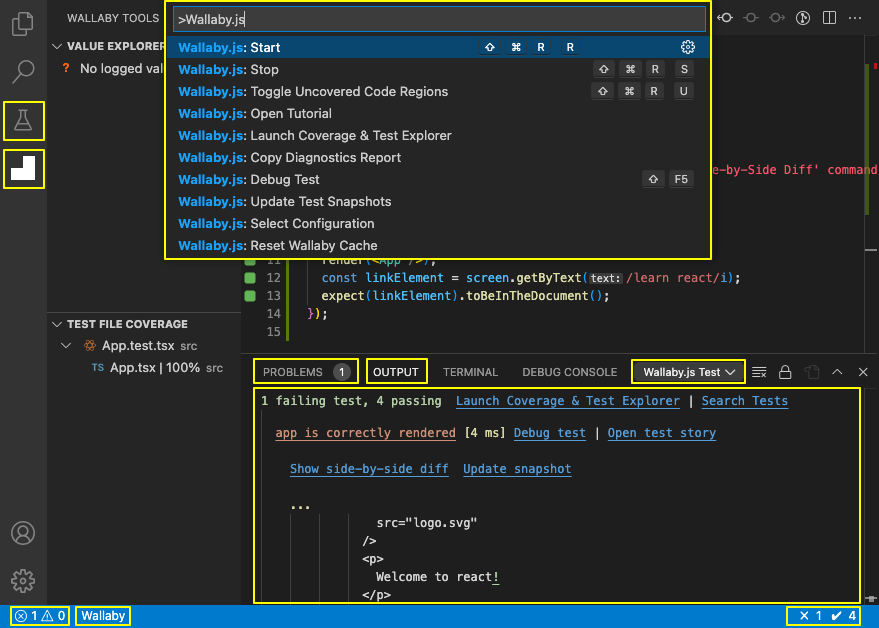
To start Wallaby on your other projects, you may use the Wallaby Start
command in your editor.
Before learning Wallaby features in detail, just to get an glimpse of the tool, please open the hello.test.js file and have a bit of play. For example, try changing the variable value to make the test fail. Don’t worry if some UI elements are not clear, we promise it will all make sense as you go through the tutorial.
Once you finish playing, you may mark this module as completed using the check box below and start the next module using the VS Code icon next to the next module header.
Instant Affected Test Execution
- How and when Wallaby executes your tests
- What affects your test execution speed when Wallaby runs your tests
Wallaby only re-runs tests that are affected by your most recent code changes, regardless of whether the files are uncommitted, in source control, or unsaved. This makes Wallaby the fastest JavaScript test runner available today. Let’s see it in action.
- Open the a.test.js:11 test file. There are 2 tests in the file: a slow test that takes ~1s to complete, and a fast test.
- Try changing the
faster testassertion toexpect(1).toBe(1);to make the test pass. - As you may see from how fast the editor gutter indicator turns from red to green, the
faster testis executed almost instantly. You may also see each test's execution time on the line with the test name.
The meaning and the functions of the gutter indicators are fully explained in the Inline Code Coverage tutorial module. In the context of the current tutorial module, a green indicator means that the test is passing, while a red indicator means that there is an error.
The execution speed is also visible via Wallaby’s status bar indicator which is located at the bottom right corner of the editor window. When you are making the fast test fail/pass, the indicator changes almost instantly. However, if you try changing the assertion of the slower test, you will notice the status bar indicator displays a progress bar while the test is running.
When Wallaby’s status bar indicator is not displaying execution progress bar, it displays a summary with the number of passing and failing tests in the project. Clicking the indicator also opens Wallaby Tests Output.

Despite the fact that the edited test file contains a slower test, when another test is edited, only the test affected by your code change is executed. If you start editing code outside of a specific test, for example adding additional test file dependencies or changing the test file structure, then Wallaby may need to re-execute all tests within the test file, because your changes may impact any/all of the tests.
Also notice how we didn’t even have to save any files when making code changes to make Wallaby run our tests.
Regardless of your Files: Auto Save setting value in VS Code, Wallaby runs your tests as you type and you
don’t need to save your changes to see the results. Having said that, if you want to make Wallaby only run your
tests on file save, the Wallaby.js: Make Current Session Run Only on Save command can be used.
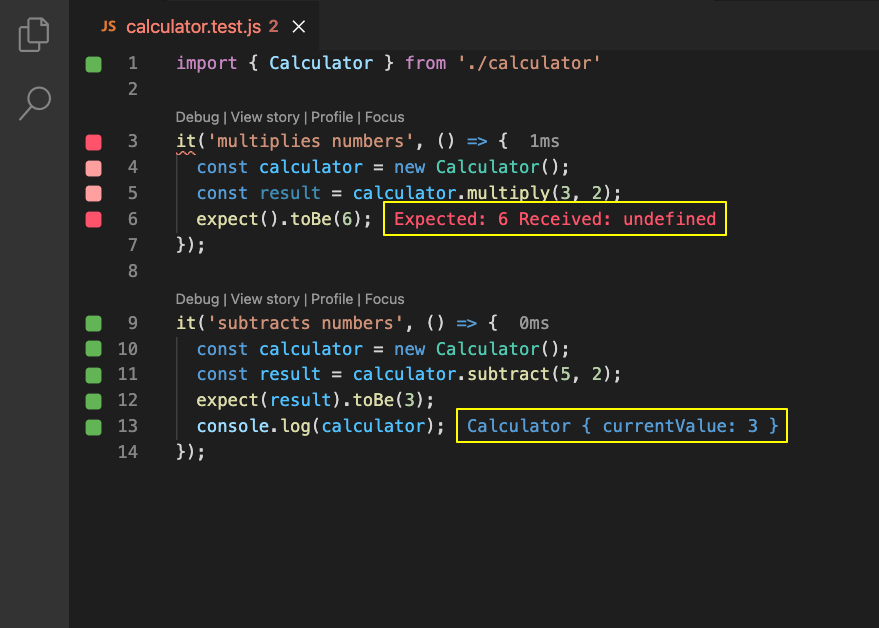
Now let’s open the calculator.test.js test file. As you may see from the
inline error message, the adds numbers test is failing.
Inline error reporting is fully covered in a dedicated tutorial module. In the context of the current tutorial module, red text to the right on the line with code displays a short message of the error that occurred while running this line of code.
The test’s assertion expect(add(1, 2)).toBe(3); is correct, so the problem must be in the source code of the
add function. Let’s open the calculator.js source file to fix the error.
Quick navigation for errors and tests, as well as advanced ways to inspect test errors, are fully covered in dedicated tutorial modules.
After fixing the add function to return a + b;, you may see from how fast the editor gutter indicator turns
from pink to green, the calculator test is executed almost instantly. Despite that fact that there are some
uncommitted and even unsaved changes in another modified test file, a.test.js,
when a specific source file is edited, only the test file that imports the source file is executed.
- You can use Wallaby to run your tests immediately as you type.
- You know that Wallaby only re-runs tests that are affected by your changes, regardless of whether the files are uncommitted, in source control, or unsaved.
- You can refer to Wallaby's status bar indicator to see your tests are running, or to quickly check if there are failing/passing tests (and how many).
Code Coverage
- How to understand what parts of your code are covered or not covered by your tests
- How to track and improve code coverage for your project
- How to configure code coverage settings
When executing your tests and code, Wallaby calculates code coverage to identify which statements of your code have been executed and which statements have not.
Code coverage for your application code is displayed in the left margin of your editor and is updated in real-time. As soon as you start changing your code, the coverage will be automatically updated. The indicators are not just a report, they are a great tool to constantly verify that your incremental code changes are affecting the desired parts of your source code.
In addition to in-editor code coverage indicators, summary code-coverage statistics with various levels of breakdown and aggregation are available in Wallaby App.
Let’s open the calculator.test.js to see it in action. As you
may see, the add
function return statement line gutter indicator is gray, which means that there is no test that executes
the line. Now if you uncomment the expect assertion
in the adds numbers test, the return statement line indicator turns green, that means that the line is fully
executed by the test.
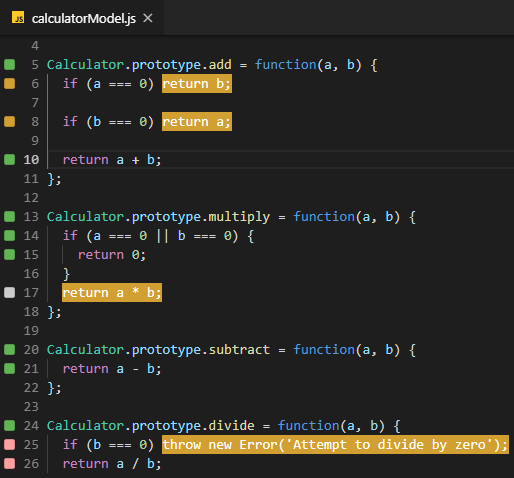
Editor Code Coverage Indicators
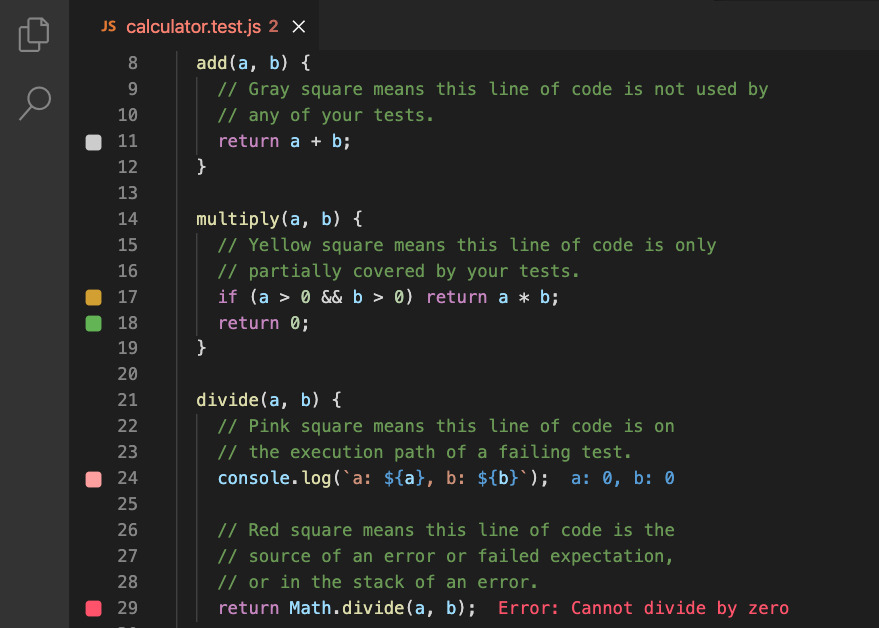
Wallaby has five different types of code coverage indicators that are displayed in the left margin of your editor as shown in the screenshot below.
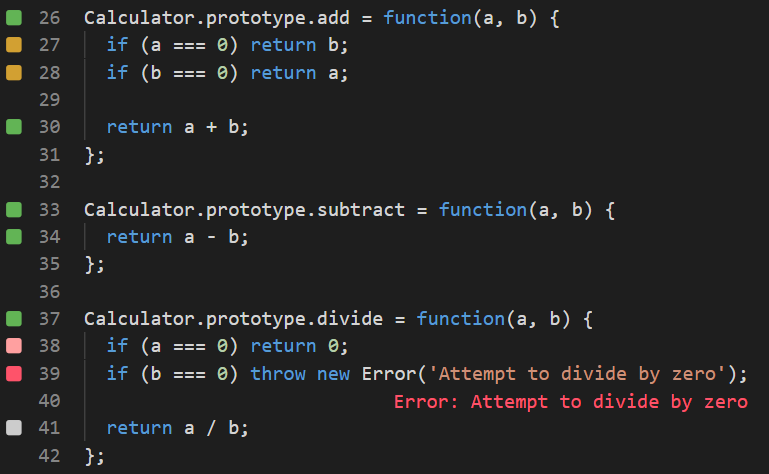
Here is what the coverage indicators mean:
a() || b() and a() is always true, which means the b() path is never executed.
Pink gutter indicators can be used to easily track the path of a failing test leading to an error. Inline error reporting is also covered in a dedicated tutorial module.
-
Coverage indicators combine code coverage data from all currently running tests.
When focusing your attention on a specific feature development, it may sometimes be useful to only see coverage
from specific tests or test files.
- Test focusing allows to only run (and see code coverage for) specific test(s).
- Test filtering allows you to limit the display of inline code coverage indicators and inline run-time values to only the test that you are working on instead of all tests in your project.
If you want to see all tests that are covering/exercising a specific line of code, may use the Wallaby.js: Show Line Tests command.
Uncovered Code Regions
Wallaby’s Toggle Uncovered Code Regions command allows you to quickly highlight regions of your
code that have not been executed
(i.e. for lines with coverage indicators that are Yellow or White). This feature is especially useful
for identifying uncovered code as you work to improve code coverage.
Tip: use Wallaby App to view your code in read-only mode with uncovered regions always highlighted.
For example, you may see that the first line of the multiply
function is marked with a yellow gutter indicator. By running Wallaby.js: Toggle Uncovered Code Regions
from your editor command palette, you will be able to see that b > 0 part of the if statement has never been
executed. This is because our test is only passing 0 as the value of the a function argument, so a > 0
logical branch yields false and prevents b > 0 logical branch (as well as the return a * b statement) from
being executed.
After uncommenting the expect(calculator.multiply(2,
0)).toBe(0) test assertion, we can run the Wallaby.js: Toggle Uncovered Code Regions command again and
this time we will see that the b > 0 logical branch is executed as expected, however the return a * b
statement is not. Finally, uncommenting the expect(calculator.multiply(2,
2)).toBe(4) test assertion makes the test pass a and b values that are both greater than zero, so
the return statement at the start of the multiply function is executed and the line gutter indicator turns
green.
Test File Coverage View
Wallaby’s Test File Coverage view allows you to quickly see the currently opened test file’s code coverage. The coverage is updated in realtime as you type.
Try opening the car.test.js file, then open Wallaby Tools from
VS Code side bar. In the Test File Coverage view you may see all source files loaded by the opened test file
and how much code coverage those source files have. Because the contents of all car tests are commented out, the
car.js file has low code coverage. You may try uncommenting test assertions in the car.test.js
file to bring the code coverage to 100%.

Coverage Settings
It is possible to adjust code coverage calculations and reporting with configuration and code comments. Refer to the configure coverage section of our docs for more information.
- You can use Wallaby's realtime gutter indicators to understand your project's code coverage and the code paths that lead to test errors.
- You can use the Test File Coverage view to quickly see the currently opened test file’s code coverage.
Error Reporting
- How to quickly see if your recent code change is causing an error
- How to quickly view inline error details, analyse and fix errors
- How to view all errors and failing tests, then select and view individual error details
As we write our tests and code, errors are inevitable. Being able to deal with them as efficiently as possible without context switching will save hours of your time, and is one of the things that makes Wallaby the most advanced JavaScript test runner available today. Wallaby provides a number of powerful tools to quickly discover, navigate, analyse and fix test errors.
Inline error messages and error gutter indicators
With Wallaby, you don’t need to context switch between the console and your editor to try and work out why a test is failing. Error messages are displayed right next to the code that caused them and gutter indicators help you quickly identify code that is related to a failing test.
Often the inline error message will be sufficient to understand what's going wrong and to fix the error straight away, especially if the top of the error's stack is on the recently changed line. For example, if we have mistyped a variable name or caused a runtime exception from the line that we have just edited.
Let’s open the calculator.test.js:4 calculator adds
numbers test. From the inline error message it’s quite obvious that the expect function name has been mistyped. After we fix it, we see another error though. The test’s assertion is correct, however the red gutter icon of the test and the inline
error message indicate that there’s the ReferenceError: x is not defined error. Let’s see how can Wallaby help us to analyse this error.
Quick navigation with Wallaby commands
If you are quite familiar with the test and the source code that may be causing the error, you may be able to quickly identify the issue from the inline error message and navigate straight to the error or navigate from the error path to the failing test.
To quickly jump to the source of the error (the first source code location is the error stack), you
may use the Wallaby.js: Jump To Error Source command, or use the error line
Jump To Error Source context action. Let’s use the command or the action to jump to and fix the failing test issue in the calculator.js:2 file by using correct parameter names in the function (change x to a and y to b).

While we are still in the calculator.js:6 multiply
function, you may see the pink gutter indicator next to the function implementation line. It means that the line
of code is on the path of a failing test. Running Wallaby.js: Jump To Failing
Test command on the line will open the test that is failing.
Running the command opens the calculator.test.js:8 calculator
multiplies numbers test. The test’s assertion is correct, however the red gutter icon of the test
and the inline error message indicate that the received multiplication result is not correct.
Jumping back to the calculator.js:6 multiply
function and fixing
the implementation to use * operator instead of +, makes the indicators green and the test is now passing.
Inspecting Error Details
When you need more details to analyze the error, such as detailed actionable error stack, full error
message, expected and actual values highlighted diff or snapshot diff, you may use Wallaby Tests
Output or
Wallaby Output Inspector.
Error Line Hover
Wallaby displays error details (and corresponding actions) such as stack with code context, as well as compact diff view for failed equality assertions and snapshots in editor hover tooltips. If you simply move your mouse over the line car.test.js:21
with an error, or use VS Code Show Hover
command on the line, you will see the error details.
Output Inspector
Let’s see Wallaby Output Inspector in action. Open the car.test.js:21
test file and simply fully select the line with the error. The inspector window with the error details will be displayed.
To view an error’s details you may also use Wallaby.js: Show Error
command, or use the error line
Show Error context action.
Output Inspector is a readonly code editor instance that has all basic built-in editor
features such as syntax
highlighting, copying, search etc. On top of that it provides a set of unique context specific actions
implemented as code lens, commands and keyboard shortcuts which make it even easier and quicker to analyze and
fix your test failures.
When Output Inspector is focused, using navigation shortcut (F12) you can quickly switch to your source code
based on your current context (where your cursor is). You may also Go to error, Go to test, Debug test, Show
side-by-side diff, Update to test snapshots, Go to snapshot.
As you may see, the displayed error details contains a detailed and actionable error stack.
Related code lines (as well as a few surrounding lines to provide better context) from relevant files are
displayed and can be navigated to by using the F12/Go To Definition shortcut. Often just opening and
analyzing error details will be enough to understand the cause of the issue and quickly fix it without having to
open and browse through multiple source files.
When a test error contains expected and actual properties, the Output Inspector, as well as the
error hover tip, displays a compact diff view and can also display a side-by-side diff view. This allows you to quickly
debug failing equality assertions and snapshots.
For example, try viewing details of another error in the car.test.js:17 file to see an example of compact diff, side-by-side diff, error line hover over window and use the update snapshot command. After updating the snapshot, also try viewing/fixing another error in the car.test.js:12 file.
Tests Output
Wallaby Tests Output is another way to view error details. While Output Inspector allows you to view specific error(s) details, the tests output window allows to see all currently failing tests.
Wallaby Tests Output ergonomically displays failing tests in your editor’s output window. All tests
that are currently failing are listed, along with errors, diffs/snapshots, error stacks and any console.log
calls. The output window’s hyperlinks allow you to navigate directly to files in your editor, for example to the
exact error line, or to a broken test.
Wallaby Tests Output can be viewed by clicking on the Wallaby status bar indicator, or
running the Wallaby.js: Show Failing Tests command.
Wallaby App
Another way to view all test errors and inspect individual tests and errors is to use Wallaby
App. The app may be launched by running the Wallaby.js: Launch Coverage and Test Explorer command.
Problems view
Another way to quickly see errors and failing tests is with VS Code’s Problems View, using the command: View: Toggle
Problems. You may quickly navigate to the location of a failing test (or its related details) by
selecting an item in the problems view. In addition to highlighting the failing test in your code file, the
failing test will also be highlighted in the VS Code file explorer.

Test Explorer
Wallaby integrates with VS Code’s Test Explorer view to allow you to view,
filter and quickly perform actions on tests that Wallaby is running. The status of tests in the Test Explorer is updated
in realtime and may be launched using Testing icon in the side bar or with
the Testing: Focus on Test Explorer View command. Common actions are available when
you hover over the test name in the Test Explorer view, and additional less-common commands are exposed via the context menu.
- You can use error messages that are displayed right next to the code that caused them.
- You know that gutter indicators show if the current line of code is the source of an error, or if it's on the execution path of a failing test or error.
- You can use editor commands (with keyboard shortcuts) and context actions to quickly navigate to the associated failing test or error source.
- You can use the Error Hover View and Output Inspector to view details of, analyse and fix inline errors.
- You can use the Tests Output view and Wallaby App to view all failing tests and errors.
- You can use VS Code’s Problems View and File Explorer to quickly navigate to errors in tests.
Inspecting Runtime Values
- How to print runtime values with and without changing your code
- How to inspect large runtime values
- How to see all logs for a test or a test file
When using Wallaby as we write our tests and code, viewing runtime values of various variables and expressions becomes a
very common task. Whether you are used to adding console.log or debugger breakpoints, Wallaby adds superpowers to
your preferred approach and provides a few powerful tools to quickly view, inspect, and analyse runtime
values.
console.log
Let’s start with a good old console.log example. Open the car.test.js:12
test and as you may see, we have a failing assertion in the opened test (that is trivial to fix), so let’s
uncomment the line to see the
value of the car variable.
As with runtime errors, console.log results are displayed inline, and if you
simply move your mouse over the line with displayed inline value, or use VS Code Show
Hover
command on the line, you will see the extended output (if it doesn’t fit inline).
Identifier expression
In addition to console.log, you may use identifier expressions (i.e. just typing a variable name)
to log any values.
Note that when using identifier expressions for logging (for example, typing a to see the value of
the a variable), you may hit some limits in terms of the number of displayed properties and the logged object
traversal depth. In this case, you may use console.log to display objects without the limitations.
Special comment
Another powerful way to log any expression is to use a special comment right after the expression you want to log.
Inserting the special comment //? (or /*?*/) after some expression will log just the value of
that
expression.
You may also write any JavaScript code right in the comment to shape the output. The code has the
access to a variable, $, which is the expression that the comment is appended to. The executed code is within a closure,
so it also has access to any objects that you may access from within the current lexical environment.
Unlike console logging, the special comment logging has some built-in smarts. For example, when you place the comment after an expression that is a promise, the resolved value of the promise is logged. Or, if an expression is an observable, then its values are displayed.
Show/Copy value command
In addition to special comments, Wallaby provides two commands that allow you to quickly get the
value of an expression without changing your code. Try selecting the car expression and using Wallaby.js: Show Value and Wallaby.js: Copy
Value commands.
You may read more about various ways to log and analyse values with Wallaby, for example how to track object value changes with object proxy or how to quickly measure performance of your code with special comments, in the dedicated docs section.
Output Inspector
When larger values are logged, using the inline view and the hover view may be insufficient to inspect the logged value. Wallaby Output Inspector provides a much better way to inspect larger values. Let’s see the inspector in action. Open the car.test.js:13
test file. To view the value of the car variable, you may select the variable in the editor and use Wallaby.js: Show Value
command, or use the line
Show Value context action. The highlighted value is displayed in the opened inspector view. Once the value is inspected, the view can be closed with the Shift + Esc command.
Output Inspector is a readonly code editor instance that has all basic built-in editor features such as syntax highlighting, copying, search etc. On top of that it provides a set of unique context specific actions implemented as code lens, commands and keyboard shortcuts which make it even easier and quicker to analyze and your logs. By default, the output inspector is displayed for all logged values that don’t fully fit into the inline view, but you may change that behavior in the settings of the inspector.
Once Output Inspector’s window is opened beside your main code editor you may switch focus to it and back by pressing Ctrl/Cmd + Shift + / shortcut (or by calling Toggle Output Inspector Focus command). To close Output Inspector you may use Shift + Escape shortcut (Close Output Inspector command).
Output Inspector can show multiple output fragments (errors and/or values) together, however if you are not interested in some of them anymore then you may delete them by pressing the Del or Backspace
keys anywhere inside an output fragment. In addition, the Remove code lens is also available on the top of an output fragment.
Value Explorer
While Wallaby Output Inspector is good for displaying larger values in a highlighted text form, Wallaby Value Explorer displays values in a tree view. The tree can be expanded to any depth and can copy paths/values to the clipboard.
Open the car.test.js:12
test and uncomment the line to log the value of the car variable (if it is not uncommented yet). Now open Wallaby Tools from the VS Code side bar, and you may browse the logged value using the Value Explorer view. To view any logged value (regardless of how the value is logged) you may also use the Wallaby.js: Reveal in Value Explorer
command, or use the line
Reveal in Value Explorer context action.
Tests Output
Wallaby Tests Output is another way to view values logged from tests. Any values logged from failing tests are displayed there. If you want to see logged values of a specific (and not necessarily failing) test, you may use the Wallaby.js: Show Line Tests command.

Wallaby App
To view all values logged from a test file or a test and inspect the logged values you may also use Wallaby
App. Wallaby App may be launched by running the Wallaby.js: Launch Coverage and Test Explorer command.
When logging is performed for lines of code that are executed by multiple tests, multiple runtime values are displayed. To select a specific test to display the output for, refer to the Test focusing and filtering tutorial module.
Another way to focus on debugging a specific test and quickly inspect runtime values for a specific
test is to start Wallaby Time Travel Debugger. The debugger can be
started with the Wallaby.js: Debug Test command on any line of code. The debugger allows you to move forward and
backwards through your code to understand the conditions that led to a specific bug. The Time Travel Debugger accelerates your
edit, compile and debug loop by allowing you to jump to a specific line of code, view runtime values, edit-and-continue and step into, over and out of your code.
- You know that runtime values are displayed right next to the code that logs them.
- You can log values with Wallaby using: console.log statements, identifier expressions, special comments and context command/actions.
- You can use the Hover View and Output Inspector to inspect larger logged runtime values.
- You can use Value Explorer to display logged values in an easy-to-navigate, real-time tree view that can be expanded to any depth.
- You can use Tests Output view and Wallaby App to view logs of specific tests or test files.
Debugging
- How to debug your tests with Wallaby time travel debugger
- How to see the execution path of a test in a single logical view
Being able to debug your tests is a crucial part of a modern development workflow. While a classical debugger can be helpful (and you can use it with Wallaby), it has not been designed to support a fast edit-and-continue test feedback loop.
Time Travel Debugger
Wallaby’s time-travel debugger provides a turn-key ergonomic debug experience that unlike a general purpose debugger was built from the ground up for debugging tests.
Open the car.spec.js:6 test. As you may see, the second assertion of the test (that checks that the car should not be in future when its speed is equal to zero) is failing. Let’s see Wallaby debugger in action.
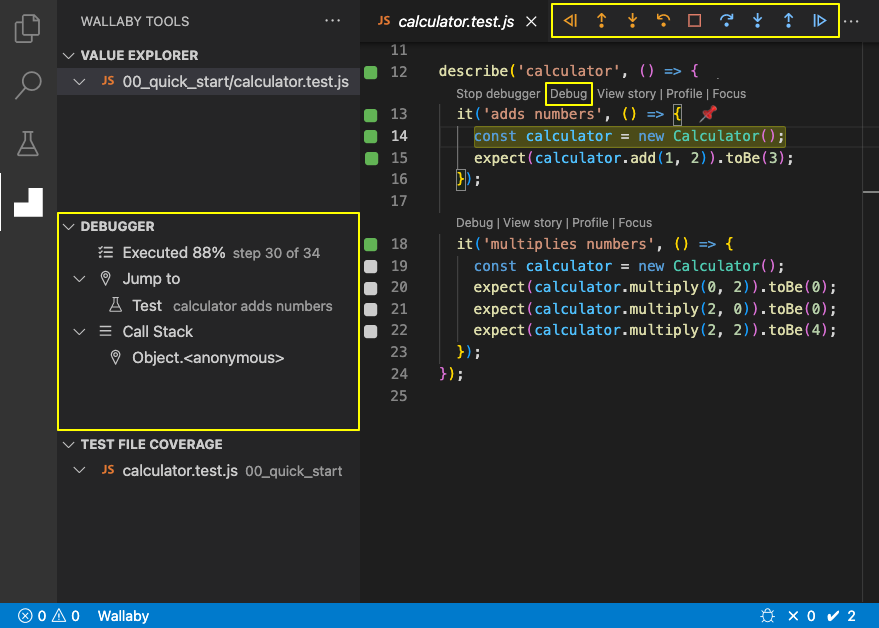
Click the Debug code lens above the test name. You may also use the Wallaby.js: Debug Test command on any line of code that you would like the debugger to start at.
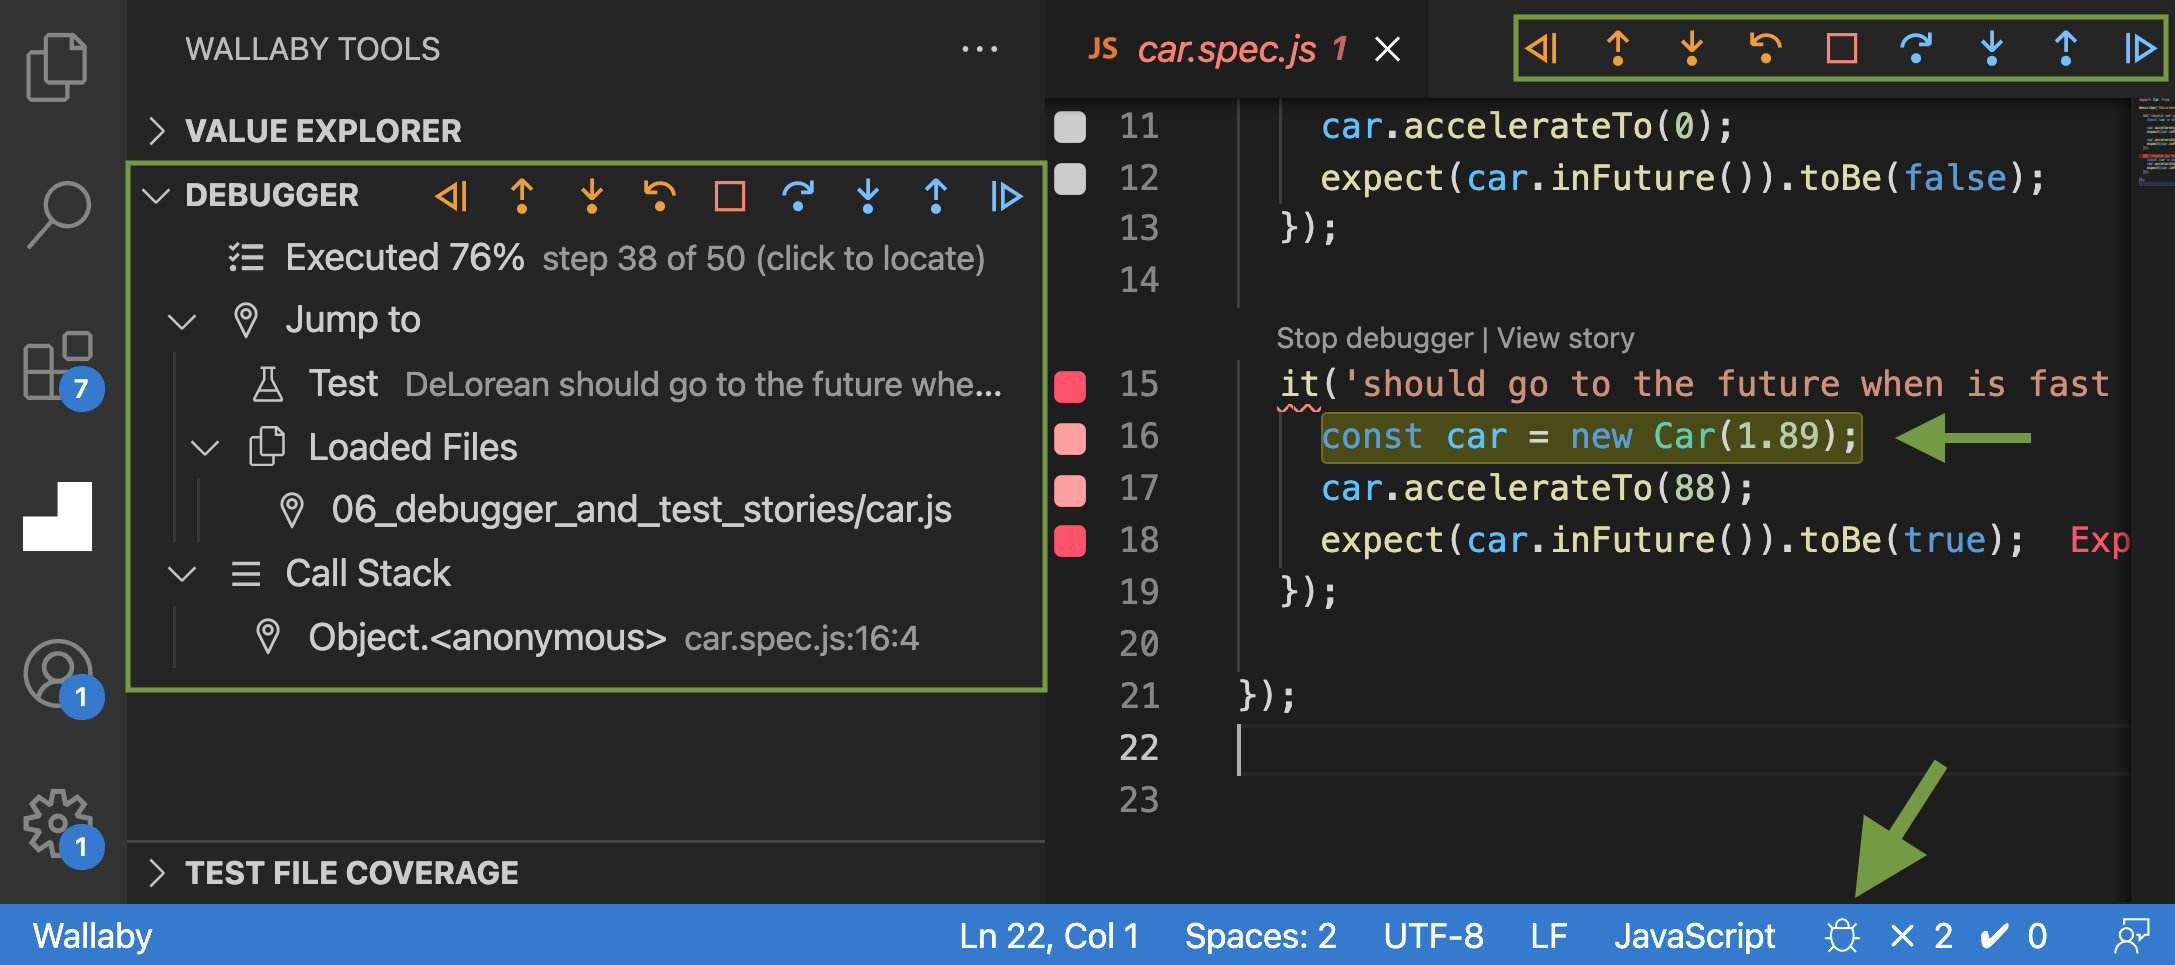
In VS Code sidebar on the left you may see the Debugger View. It shows the number of steps that were executed as a part of your debug session and also shows the current step and percentage executed.
The Jump to menu provides the ability to quickly navigate to important parts of your project that were identified during the test run. You may navigate to the start of the test by clicking on the Test node. You may also jump to the first statement of any files used by your tests by clicking on one of the Loaded Files nodes.
Debug Actions are available from from the Debugger file actions and Debugger View header, as well as via keyboard shortcuts.
The currently debugged line of code is highlighted in the editor. The debug icon in Wallaby’s VS Code status bar indicator shows when the debugger is active.
Try using the Run Back to Active Line debugger action to jump to the code line before the assertion: car.accelerateTo(0); and then try stepping into the car.accelerateTo function with the Step Into debugger action.
As you are using the debugger, you may inspect any runtime values by simply selecting them in your editor. Selected values can be inspected inline as well as in Output Inspector and Value Explorer.
When stepping through the code in the car.js:13 file, you will be able to spot that the this._inFuture field’s value is incorrectly set to true. At this stage, you may simply fix the code (by removing the line or setting the value to false), and continue to use the debugger without having to restart it.
Wallaby’s time-travel debugger can be started from any line of code with a single click, there are no special steps to perform to start using it, even breakpoints are optional. You can step forward and backward through your code to understand the conditions that led to a failing test. To inspect the runtime value of a variable, you may simply select it. Unlike a traditional debugger experience, Wallaby’s debugger allows you to edit your code and continue your debug session with the modified changes.
Test Stories
While it is useful to be able to quickly start the debugger and explore certain parts of the executed code, sometimes you may not know where to start with, and just want to see everything that the test is doing, without having to open and jump between lots of different source files.
Wallaby’s Test Story Viewer provides a unique and highly efficient way of debugging your code and inspecting what code your test is executing in a single logical view.
Let’s open the car.spec.js:18 remaining failing test. We know that the car should go to the future when its speed reaches 88 mph, however it doesn’t happen and our assertion fails. Let’s use Wallaby Test Story viewer to find out why.
Click the View Story code lens above the test name to open Wallaby Test Story viewer beside your code. You may also use the Wallaby.js: Open Test Story Beside command to do the same.
The opened test story view shows the full execution history of the selected test. Executed lines of code display as they would in your code editor, while lines that are displayed only to provide context are faded out. Whenever the execution jumps to a new file, the file name is displayed. When the execution jumps within the file, “…” is displayed.
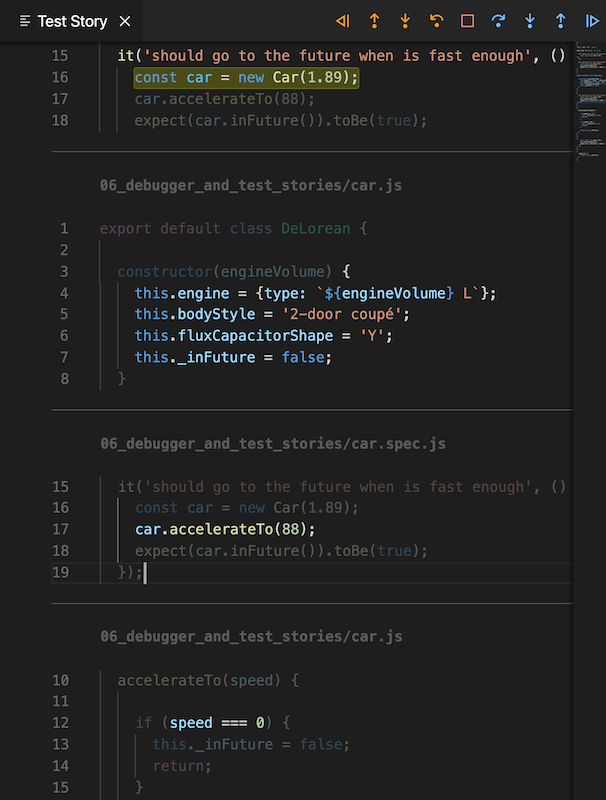
Initially, the line that you ran the Open Test Story command on will be highlighted, and you are free to scroll to the very end of the story to see the test error/last executed statement, or to the beginning of the story where test dependencies are imported. You may also search within the test story view to find a point of interest and start from there.
Wallaby’s Time Travel Debugger is also fully available when a Test Story is displayed. This means that you can: step in/out/over back and forth, or run to a specific code line; select any expression in the executed code to inspect its value.
Note that when a test story is opened beside your code, Wallaby debugger navigation will be reflected both in the test story and in the original files. This mode may be useful if you are planning to edit your code/test at the same time as you are reading/checking its story. There are other ways/modes to view test stories that are less attached to the debugger or current state of your code.
If we follow the test story by scrolling down, we will spot that the car.js:17 condition preventing the required code from being executed is faded out (not executed), because it is using the > instead of >= to check the car’s current speed. We can quickly use debugger actions to jump to the condition to verify the speed variable value (by simply selecting it) and then switch to the code editor on the right (F12 from the test story code line will also work) to fix the source code.
Test Profiler
To analyze your tests’ runtime performance, you may use Wallaby Test Profiler. Wallaby Test Profiler allows you to quickly record a test’s CPU usage profile and inspect it using flame chart and top-down/bottom-up views.
- You can use Wallaby’s Time Travel Debugger to move forward and backwards through your code to understand the conditions that led to a specific bug.
- You know that the Time Travel Debugger accelerates your edit, compile and debug loop by allowing you to jump to a specific line of code, view runtime values, edit-and-continue and step into, over and out of your code.
- You can use Wallaby’s Test Story Viewer to provide a unique and highly efficient way of debugging your code and inspecting what code your test is executing in a single logical view.
Test Focusing and Filtering
- How to focus on a specific test
- How to make Wallaby run only selected tests or test files
- How to filter coverage and output for a specific test
Test focussing
Sometimes when writing or debugging a test, set of tests or test file for a particular feature, you may want to only execute
the specific test, set of tests or test file and see code coverage and output only for the specified scope.
Wallaby fully supports testing frameworks test focusing functions such as it.only, as well as special comments to focus/skip specific test files.
Wallaby also allows you to start for a selected file or folder using the Exclusive Test Run feature. If you have a large test suite which takes long time to run you may
use the Start Exclusive Test Run command/menu item, which allows you to select a test file or a folder which contains the tests files you would like to focus on and start Wallaby and only run those tests.
If you have already started an exclusive test run and would like to focus on additional tests files (or a folder) then you may use the Add to Exclusive Test Run command/menu item.
To reset the exclusive test run and run all your project tests you may use the Run Project Tests command.
Test filtering
Test Filtering allows you to limit the display of coverage indicators, console messages, live comment messages and errors messages to only the tests that you are working on instead of all tests in your project.
Wallaby supports three ways of adding and removing tests and test files to/from the test filter:
Add test to filterandRemove test from filtercode actions
Toggle Test Filtercommand
- Wallaby App (with full editor synchronization)
You may clear the test filter by pressing Shift+Esc or by executing the Reset Test Filter command, also the Reset Filter link in Wallaby.js Tests output pane and the Reset Test Filter button in Wallaby App are available for you.
You may notice there is some overlap between Test Focusing and Test Filtering, but there are two key differences between them:
Test Filteringin contrast to theTest Focusingdoes not re-execute your tests when applying/clearing the filter. When you change from only running selected test(s) to running all tests in your project, all tests are re-run; theTest Filteringdoes not re-run any tests when the filter is set or cleared.Test Filteringdoes not actually change Wallaby’s run-time behavior (after any code change, the minimum set of affected tests will be re-run). In contrast, theTest Focusingfeature may enable a more efficient workflow for large repositories with many test files, or for slower tests, as Wallaby will only process/run the selected tests.
- You can use Wallaby test focusing to execute and keep executing a single test or a test file
- You can use Wallaby test filtering to limit the display of coverage indicators, console messages, live comment messages and errors messages to selected tests only
Miscellaneous
- Commands that are provided by the Wallaby extension
- How to change Wallaby's automatic start behavior
- How to change Wallaby icon colors
- How to use Wallaby with WSL and Remote Containers
Commands
To help you with writing/navigating your code and tests more efficiently, Wallaby provides a few commands. You may see the full list in the Wallaby.js Command Palette (Ctrl/Cmd + Shift + =).
These commands include:
- Show Line Tests: allows you to quickly view all tests (both failing and passing) that cover the current line of code, navigate to test and code errors, view console messages related to some specific test or some source code line.
- Jump To Test: allows quick search and navigation to a test.
- Jump to Failing Test: allows quick navigation to the failing test from any ‘pink’ context (the failing test execution path).
- Jump to Line Test: allows quick navigation to test(s) (failing or passing) that cover the current line of code.
- Jump to Error Source: allows quick navigation to the source of the test error from any ‘pink’ context (failing test execution path).
- Toggle Uncovered Code Regions: displays/hides uncovered regions for an opened file. The command is very useful for ‘yellow’ lines to display what is not covered on the line. Highlighted markers will automatically disappear when you start editing your code or if you press
Esc.
- Run Line Tests: runs a single test (if invoked from within the test) or all related tests (if invoked within some source code covered by the tests).
- Run File Tests: runs all tests within the test file it is invoked in, or all tests in all the test files that cover the source file that the command is invoked within.
- Run Project Tests: runs all tests in your project.
- Update Project Snapshots: updates all Jest snapshots in your project.
- Update File Snapshots: updates all Jest snapshots in the current (focused) file, or all snapshots in all the test files that cover the source file that the action is invoked within.
- Update Test Snapshots: updates snapshots of a single test (if invoked from within the test) or all snapshots in all related tests (if invoked within some source code covered by the tests).
- Toggle Test Filter: adds or removes a test or a test file to/from the test filter.
- Clear Value: clears Live Values on a line that were displayed by using Show Value command (press
Escto execute the command). - Clear File Values: clears all Live Values in a file that were displayed by using Show Value command (press
Esc Escto execute the command). - Clear All Values: clears all Live Values in a project that were displayed by using Show Value command.
- Add to Exclusive Test Run: adds the tests from the currently opened file to the exclusive test run. The command is also available as a context menu item in the Explorer tree that works for files and folders.
- Start Exclusive Test Run: starts Wallaby in exclusive test run mode by executing the tests only from the currently opened file.
- Show Last Screenshot: the command displays the screenshot for the last run test (Important note: this feature works only when running your tests using Chrome and PhantomJs).
- Make Current Session Run on Any Change: the command makes your current Wallaby session start a test run when code is changed in your editor or when code is saved on disk.
- Make Current Session Run Only on Save: the command makes your current Wallaby session start a test run ONLY when code is saved on disk.
- Toggle Current Session Run Mode (Any Change/On Save): the command toggles between Make Current Session Run on Any Change and Make Current Session Run Only on Save.
Changing Wallaby’s Start Mode
By default, Wallaby will try to automatically start when you open your folder or workspace if it was running when the VS Code window was closed. If you never started Wallaby, then it will never try to run for your project. If Wallaby was started (either automatically or using a command) but test results were never returned, then Wallaby will not try and start automatically when the folder or workspace is re-opened.
After starting Wallaby, if you do not want Wallaby to start automatically when your folder or workspace is re-opened, run the Stop command.
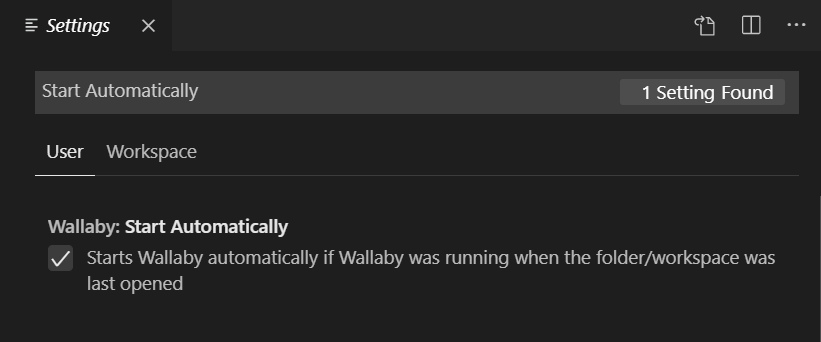
If you never want Wallaby to start automatically, then you can disable this behavior entirely. The option may be configured globally as a User preference
and may also be overridden as a Workspace preference. To change the setting, use VS Code’s Preferences: Open Settings (UI) command and
tick/untick the Start Automatically checkbox:
Changing icon colors
Coverage indicator colors may be changed in VS Code user settings (settings.json file). You may find the example with the default colors below.
  {
    ...

    "wallaby.colors": {
      "covered": "#62b455",
      "errorPath": "#ffa0a0",
      "errorSource": "#fe536a",
      "notCovered": "#cccccc",
      "partiallyCovered": "#d2a032"
    }
  }
Windows Subsystem for Linux (WSL)
For Microsoft Windows environments, Wallaby may be configured to run using WSL. Both WSL1 and WSL2 are supported within VS Code. To find out which version you are using, run the terminal command wsl --list --verbose.
WSL 2
You must first install Microsoft’s VS Code Remote WSL extension. Wallaby will automatically use WSL2 when a remote WSL session is available.
There are two ways to start a VS Code WSL session:
- Open a WSL terminal for your installed Linux distribution and type
code . - Start VS Code, Press
Ctrl/Cmd+Shift+Pand selectRemote-WSL: New Window
After starting a remote WSL session, you must install the Wallaby extension for your WSL distribution from the Extensions view.
You must also re-apply your Wallaby license to your remote WSL distribution.
The supported runtime environments for WSL2 are node.js and chrome (headless).
If you are using node.js then you do not need to do anything further to use WSL2.
If you are using chrome (headless)
then the default permissions for your WSL distribution restrict browser tests from being run.
You must update your Windows Firewall settings in order for your tests to be able to run.
The only known configuration to enable connectivity between the host
and the WSL2 distribution is to exclude the vEthernet (WSL) network from your list of
public protected network connections in your Windows Defender Firewall settings.
WSL 1
The WSL1 configuration option is available through your VS Code settings. To use WSL1, you must set wallaby.useWsl to true, for example:
 {
    "wallaby.useWsl": true
  }
This setting is ignored on non-Windows environments. If configuring a custom version of node, the path must refer to a version of node on your Linux installation.
Please note that you need to restart VS Code after changing the configuration before the change will take effect.
Remote Containers
Wallaby supports running in remote Docker containers from within VS Code. Our wallaby-vscode-remote-containers
sample repo includes .devcontainer settings for sharing your local wallaby license with a dev container
(see .devcontainer/docker-compose.yml and .devcontainer/devcontainer.json). If you do not share your local wallaby license with your dev containers then you will need to
reapply your Wallaby license every time your container is rebuilt.
To run Wallaby in a container with the sample repo:
- From the command line, run:
git clone https://github.com/wallabyjs/wallaby-vscode-remote-containers.git. - Open the
wallaby-vscode-remote-containersfolder created by step 1 in VS Code. - Run the VS Code command
Remote-Containers: Reopen in Container. - Run the VS Code command
Wallaby.js: Start.
- You know all Wallaby commands that help you writing/navigating your code and tests more efficiently.
- You can change whether Wallaby starts automatically for your project.
- You can customize Wallaby indicator colors in VS Code user settings.
- You know how to configure Wallaby to run using WSL or remote Docker containers.
Troubleshooting
- How to find out why something is not working as expected
- Where to ask questions and report problems
Sometimes things may not work as you are expecting them to, which can happen for various reasons. In this module we'll describe how to find out if there is anything wrong and to quickly fix the issue or get the answers.
Before you start troubleshooting, please make sure that your tests are running correctly (and passing) outside of Wallaby. Often the root cause of a Wallaby problem is an error in your tests/application code, or else a problem with your test runner configuration.
When you are not getting the results that you are expecting, or it looks like Wallaby is misbehaving, or stopped working after some of your dependencies updates, please check Wallaby.js Failing Tests and Wallaby.js Console output channels in VS Code.
Solutions to some of the common errors are listed in the dedicated Troubleshooting docs section.
If you get stuck and can’t figure out what’s wrong, don’t get upset, it’s very likely we can help you get it working very quickly. We are always happy to help you and normally respond to any request within hours. Please check the list below for the way to contact us and get support.
- Check Wallaby's Failing Tests and Console output channels in VS Code which display Wallaby runtime errors (including configuration errors).
- Check out our comprehensive and easily accessible documentation. If you're just getting started or you are not sure how something should work, our documentation is a great source of information.
- Search our issue repository to see if your problem has already been solved. It is the best place to ask questions and report problems. You may also use our issue repository to make suggestions and request new features.
- If for security or privacy reasons you are not happy to raise an issue through our issue repository, contact us at hello@wallabyjs.com.
- Use Wallaby's community discord chat to discuss tips and tricks, and solve problems with the help of other Wallaby users.